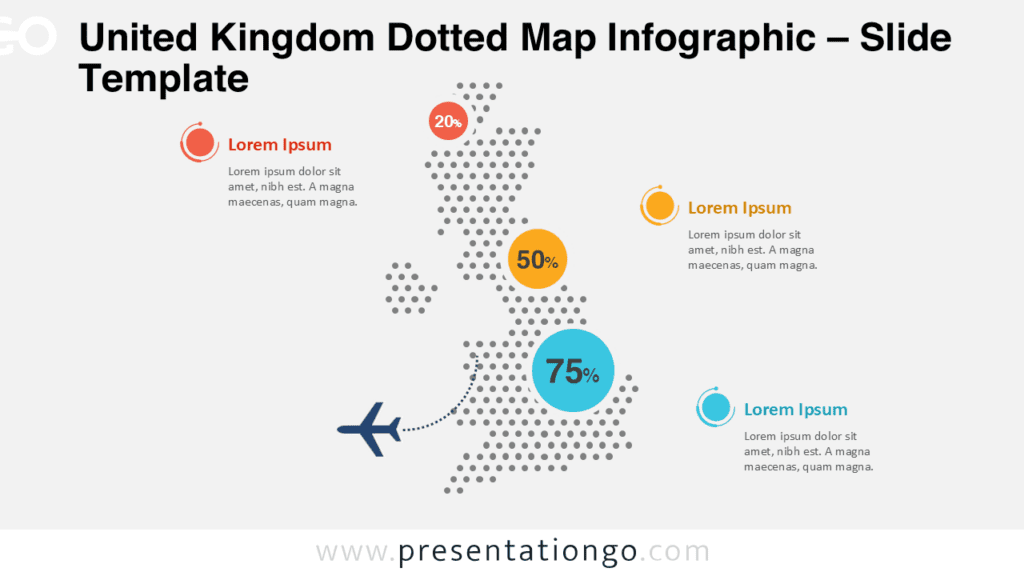
The UK Insights Map gives you a clear way to present regional information across the United Kingdom. This editable map diagram works well for business analysis, public data, market research, and territory planning. You can use it in PowerPoint and Google Slides to turn geographic information into a structured visual story.
Slide Template Preview


This diagram includes two slide versions for flexible use in different presentation styles. The main layout places the UK map on the right and supporting insight blocks on the left. Each section gives you room to explain a key metric, trend, objective, or regional observation. A dedicated key insight callout helps you highlight the main takeaway from your analysis.
Features and Customization Options
- Fully editable UK map with selectable regions, so you can adapt the visual to your data story.
- Map colors can be changed easily to match your brand, report style, or presentation theme.
- Icons come from the Office icon library and are easy to modify, recolor, resize, or replace.
- Editable icon placeholders help you personalize each insight block without rebuilding the layout.
- Text areas let you replace sample content with metrics, findings, actions, or recommendations.
- The key insight callout gives you a focused space for your main message or executive summary.
- Compatible with PowerPoint and Google Slides.
Design and Structure
The UK Insights Map uses a balanced composition that separates geographic context from written insights. The map area draws attention first, while the left column organizes supporting details into four clear blocks. This structure helps your audience compare regional points without losing the main message. The callout adds emphasis and creates a natural focal point for strategic conclusions.
You can adapt this diagram for both high-level summaries and detailed reporting. Use the map to show areas of focus, then use the side blocks to explain performance, opportunities, risks, or next steps. Because the regions, text, icons, and callout remain editable, you can quickly create a presentation that matches your specific topic.
Practical Applications
- UK market analysis and regional segmentation
- Sales territory planning and performance reviews
- Public-sector reports and policy presentations
- Customer distribution and audience mapping
- Business expansion plans and location strategy
- Education, geography, and research presentations
Summary
The UK Insights Map helps you explain regional information with clarity and structure. It combines an editable UK map, Office library icons, insight blocks, and a strong callout area. Use it to build professional PowerPoint and Google Slides presentations for analysis, strategy, reporting, and decision-making.