The USA Insights Map helps you present U.S. information with clarity and structure. This editable diagram gives you a complete United States map, supporting text areas, Office icons, and a key insight callout. You can use it to explain regional performance, market coverage, demographic trends, logistics zones, or public data. The layout works in PowerPoint and Google Slides, so you can adapt it quickly for your next presentation.
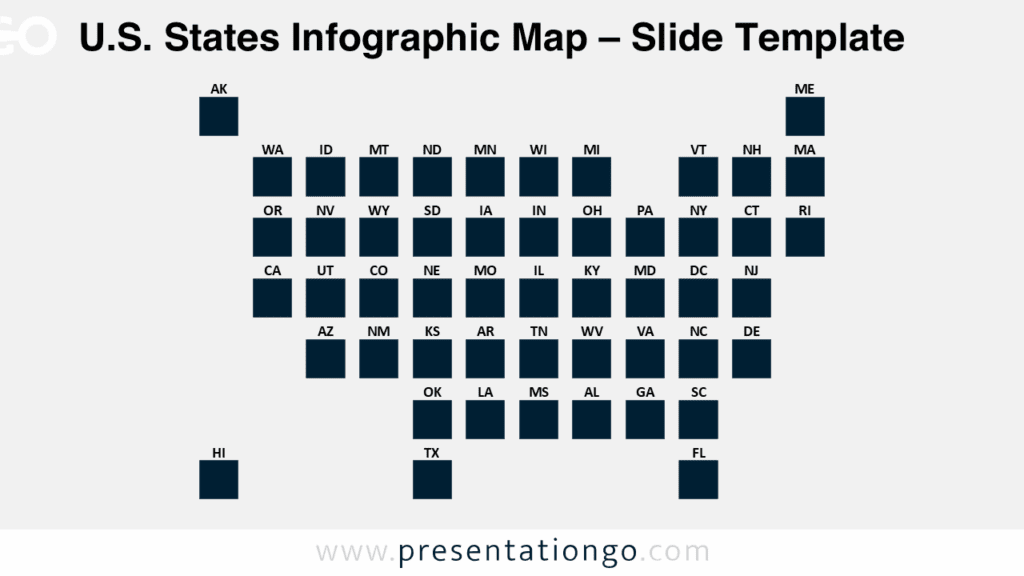
Slide Template Preview


Features and Customization Options
- Fully editable United States map with separate state shapes.
- Easy customization of map areas, state fills, labels, and text boxes.
- Office icon library elements that you can modify, recolor, replace, or resize easily.
- Editable icon placeholders for statistics, goals, audiences, charts, or business topics.
- Dedicated key insight callout for summarizing your main message.
- Separate inset areas for Alaska and Hawaii.
- Works in PowerPoint and Google Slides with standard editing tools.
The map is completely editable. You can select individual states, adjust their appearance, change their fills, edit borders, and adapt the map to your own data story. This makes the USA Insights Map useful for both quick edits and detailed regional analysis. You can also update every text block, headline, icon, and callout to match your topic.
The icons come from the Office icon library, which makes them practical for everyday editing. You can change their size, position, and appearance directly in PowerPoint. You can also replace them with other Office icons or use your own visual assets. This flexibility helps you keep the diagram aligned with your message and brand.
Design and Structure
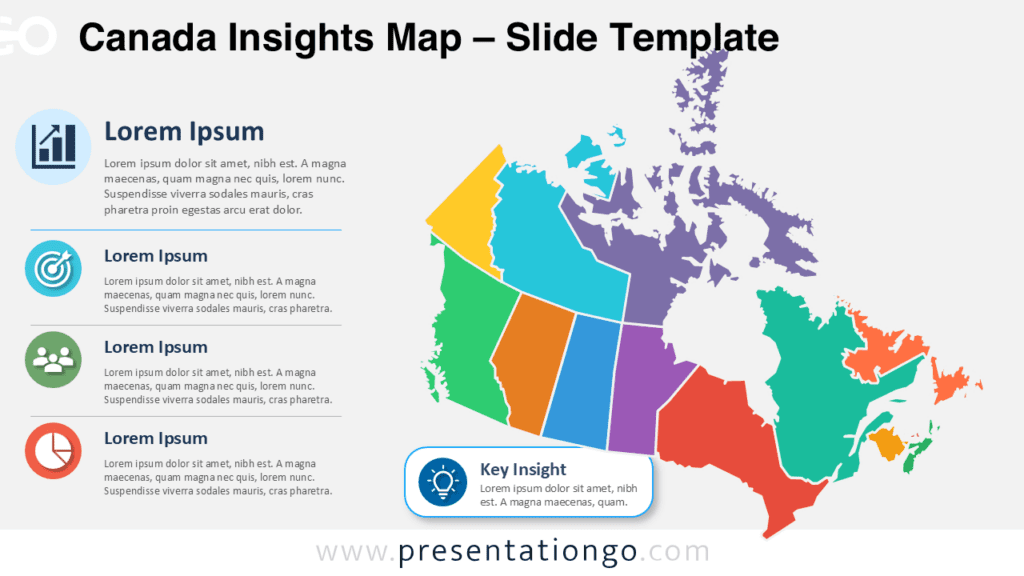
The diagram places the United States map as the main visual focus. A vertical information panel supports the map with four editable content blocks. Each block combines an icon, a heading, and a short description. The lower section includes separate map insets for Alaska and Hawaii. A key insight box appears in the bottom-right corner and helps viewers remember the main takeaway.
This structure gives presenters a clear reading path. Viewers can first understand the national overview, then review supporting points, and finally retain the main insight. The balanced composition works well for strategic presentations, classroom lessons, business reports, and executive summaries.
Practical Applications
- Compare sales results, market share, or regional performance across the United States.
- Present customer distribution, franchise coverage, or expansion priorities.
- Explain logistics zones, delivery areas, or supply chain regions.
- Show demographic trends, survey results, or public-sector indicators.
- Support education slides about U.S. geography, states, and regional analysis.
- Build consulting reports, business reviews, and stakeholder presentations.
Summary
The USA Insights Map gives you a flexible way to present regional information in PowerPoint and Google Slides. Its editable map shapes, Office icon elements, text sections, and key insight callout help you turn U.S. data into a clear visual story. Use it to highlight trends, compare areas, or explain strategic decisions with a polished map infographic.