The Canada Insights Map helps you present regional information with clarity and structure. This editable slide works in PowerPoint and Google Slides, so you can adapt it for business, education, policy, or research reports. Use it to highlight Canadian territories, compare regional performance, or summarize key findings in a visual format.
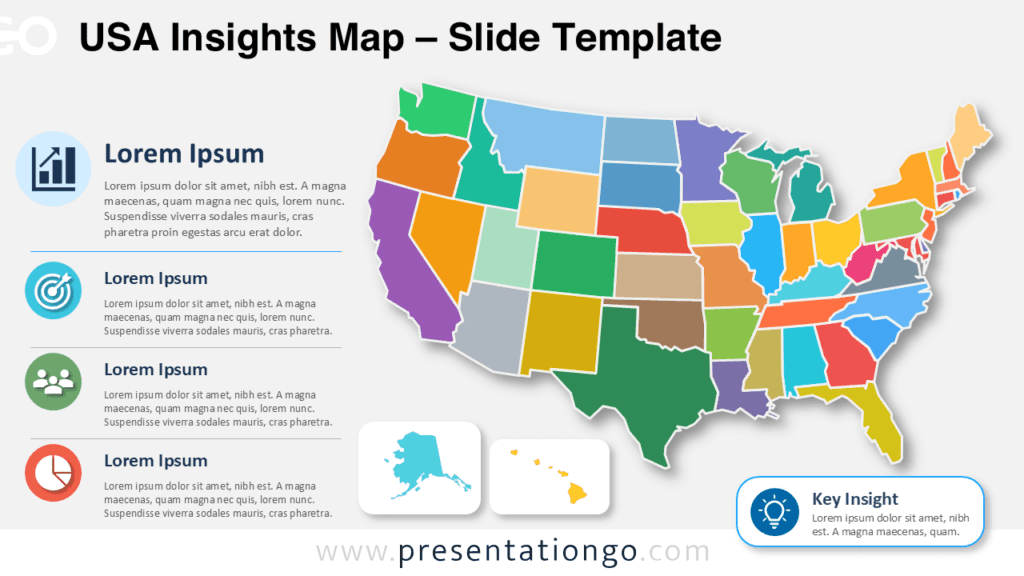
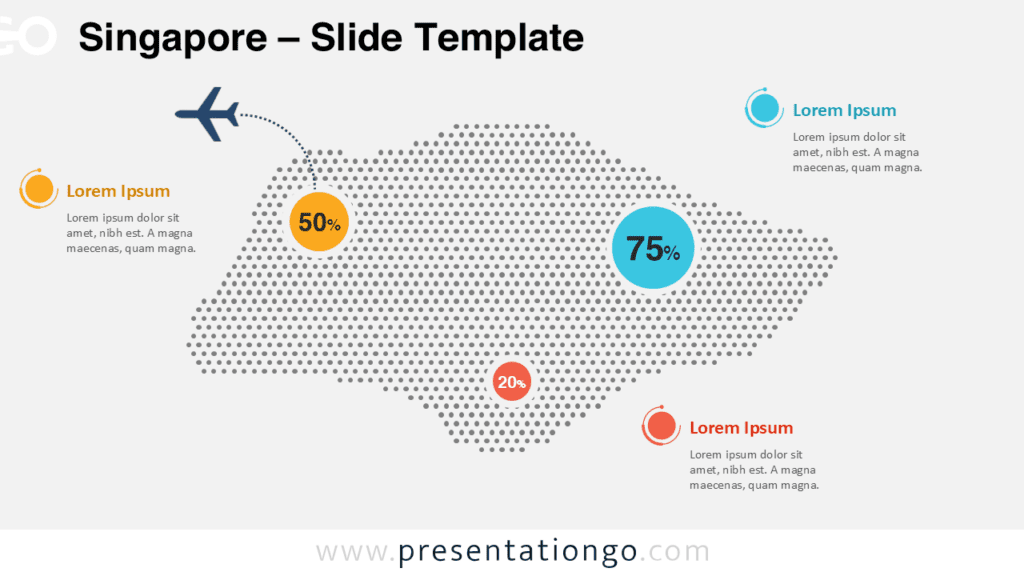
Slide Template Preview


Features and Customization Options
This Canada Insights Map includes a fully editable map, editable text areas, and a practical key insight callout. You can select each map section and adjust it to match your message, data, or reporting needs. The map is completely editable, so you can modify regions and change colors easily without rebuilding the slide.
The icons come from the Office icon library and work as editable placeholders. You can resize them, recolor them, replace them, or remove them in a few clicks. This makes the layout flexible for dashboards, sales reports, strategic plans, and regional summaries.
- Editable Canada map with separated regional areas.
- Four structured insight blocks with icons and text.
- Key insight callout for the main takeaway.
- Office library icons that are easy to modify.
- Compatible with PowerPoint and Google Slides.
Design and Structure
The layout places the map on the right and supporting insights on the left. This structure helps your audience read the content in a clear order. The left column groups each message with an icon, heading, and short description. The large map then gives the slide strong geographic context.
The lower callout area adds emphasis to one central message. Use it to show a key metric, conclusion, opportunity, risk, or recommendation. Since every major element is editable, you can adapt the slide for simple overviews or detailed regional analysis.
Practical Applications
The Canada Insights Map works well for teams that need to explain geographic information quickly. Business users can present sales territories, market coverage, branch locations, or customer segments. Educators can use it for geography lessons, demographic studies, or public policy topics. Consultants can turn regional findings into concise client-ready visuals.
- Regional sales and market analysis.
- Canadian territory planning.
- Policy, education, or research summaries.
- Business expansion and location reports.
- Demographic or operational insights.
Summary
The Canada Insights Map gives you a clear and editable way to present Canadian regional data. It combines a map, insight blocks, Office library icons, and a key takeaway area in one professional layout. Use it to create stronger reports, simplify complex information, and customize every visual element with ease.