Free Vespa chart for PowerPoint and Google Slides. A fun non-data-driven alternative using Italian motorcycles to present relative numbers or to compare concepts. Editable graphics with numbers and text placeholders.
Vespa Chart
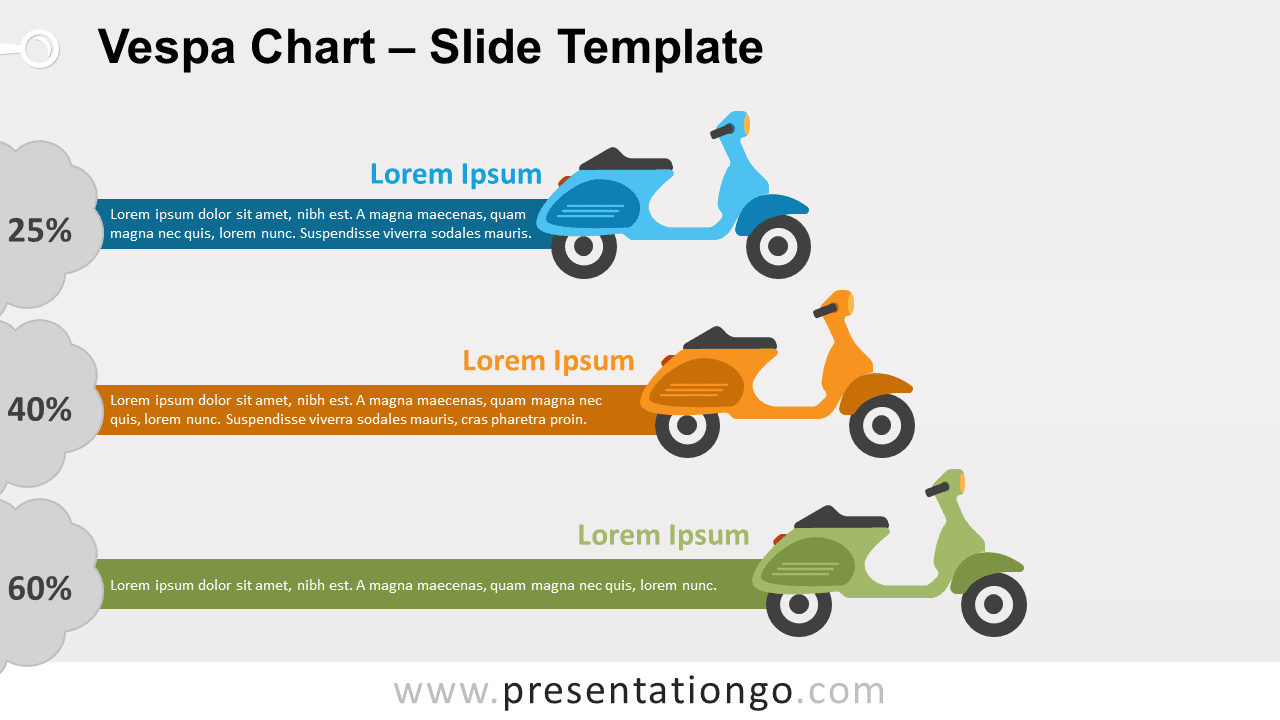
Vespa is not only a typical Italian means of transportation but also the epitome of luxury scooters. Why not use the image of a Vespa to share and compare your data? Indeed, this free Vespa Chart template will take your audience on an amazing ride!
More specifically, this non-data-driven chart presents three Vespa scooters of different colors. It gives you 3 options to present a percentage on the left side of the page, inside a bubble that looks like the exhaust fumes of the motorcycle. You can also explain your number or statistic inside the 3 colorful horizontal banners. Besides, you can add a title next to the image of the Vespa.
This free Vespa Chart infographic is ideal to present quantitative results. Moreover, the bar charts offer a perfect tool for data visualization, especially if your presentation is related to the world of transportation.
Shapes are 100% editable: colors and sizes can be easily changed.
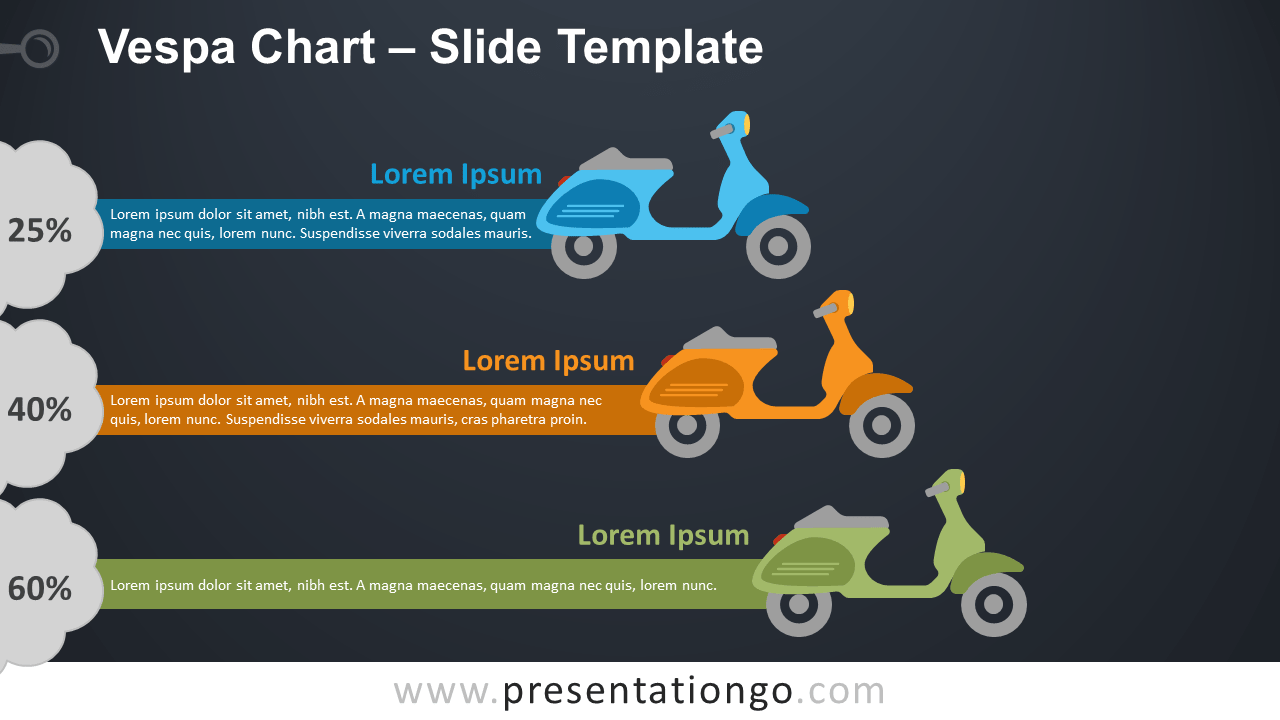
Includes 2 slide option designs: Standard (4:3) and Widescreen (16:9).
Widescreen (16:9) size preview:


This ‘Vespa Chart’ template features:
- 2 unique slides
- Light and Dark layout
- Ready to use template with numbers and text placeholders
- Completely editable shapes
- Standard (4:3) and Widescreen (16:9) aspect ratios
- PPTX file (PowerPoint) and for Google Slides
Free fonts used:
- Helvetica (System Font)
- Calibri (System Font)