Latest Templates
Discover our vast, continually growing collection of free, high-quality, customizable templates & Infographics for PowerPoint and Google Slides presentations, designed to enhance your visual communication.
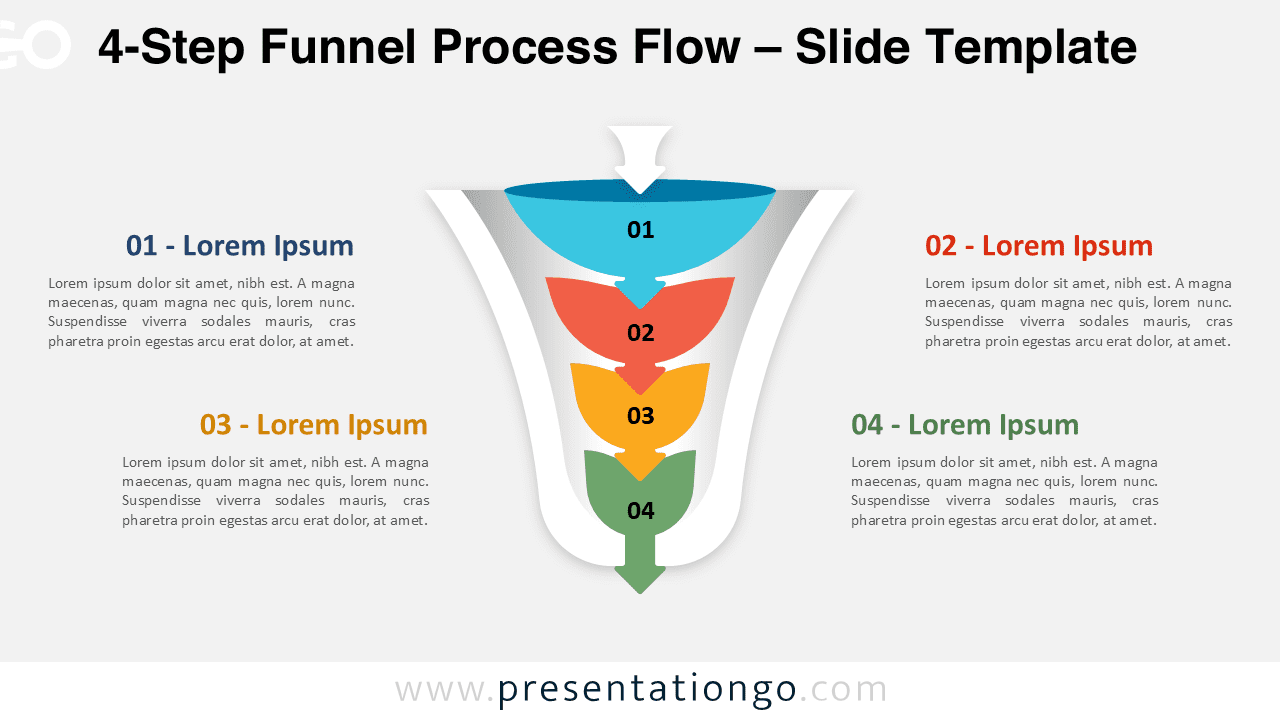
4-Step Funnel Process Flow
Visualize structured workflows like sales pipelines or project phases with this 4-step funnel process flow diagram for PowerPoint.
Google Slides, PPTX
16:9
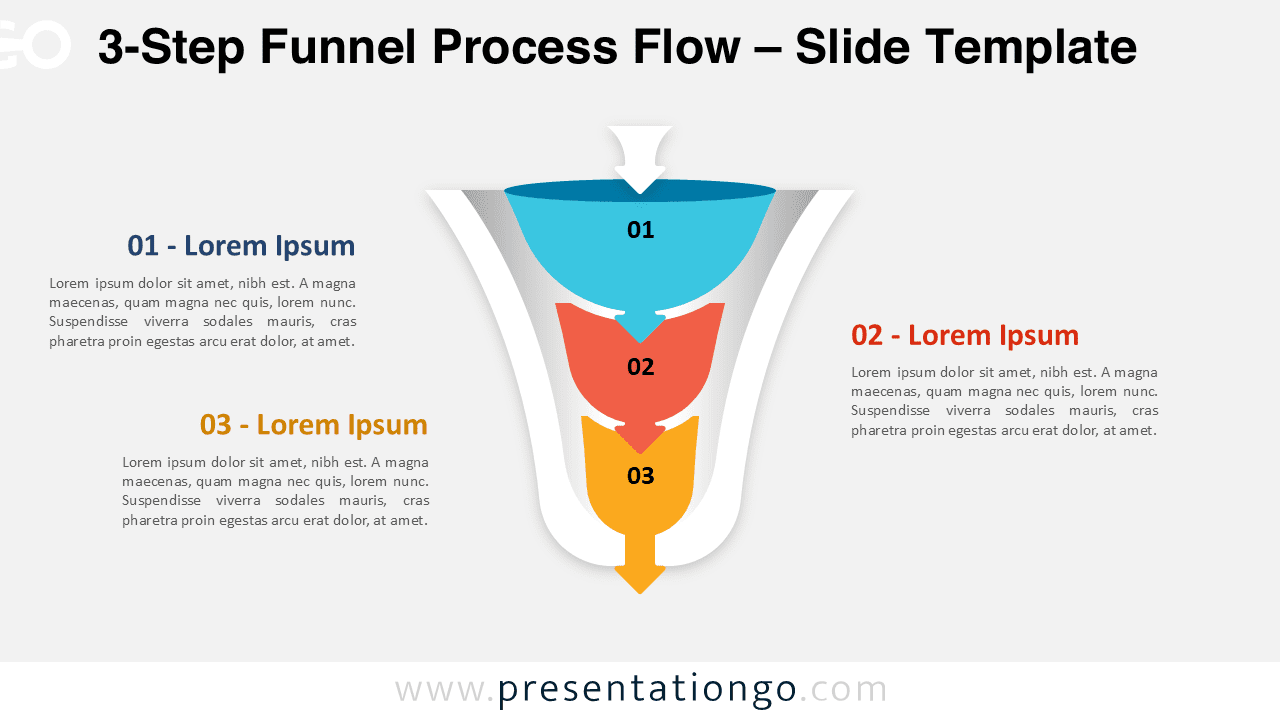
3-Step Funnel Process Flow
Showcase key stages with this editable 3-step funnel flow design.
Google Slides, PPTX
16:9
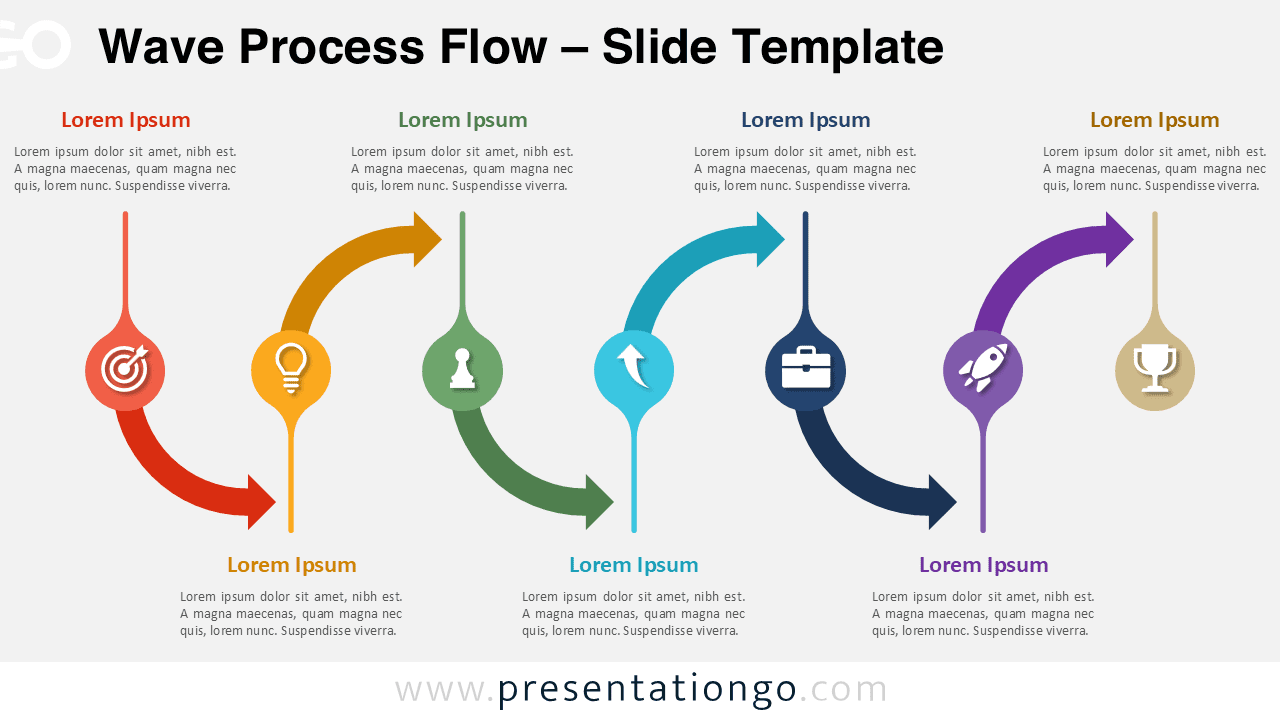
Wave Process Flow
A modern wave-style process diagram for PowerPoint and Google Slides with curved arrows and icons.
Google Slides, PPTX
16:9
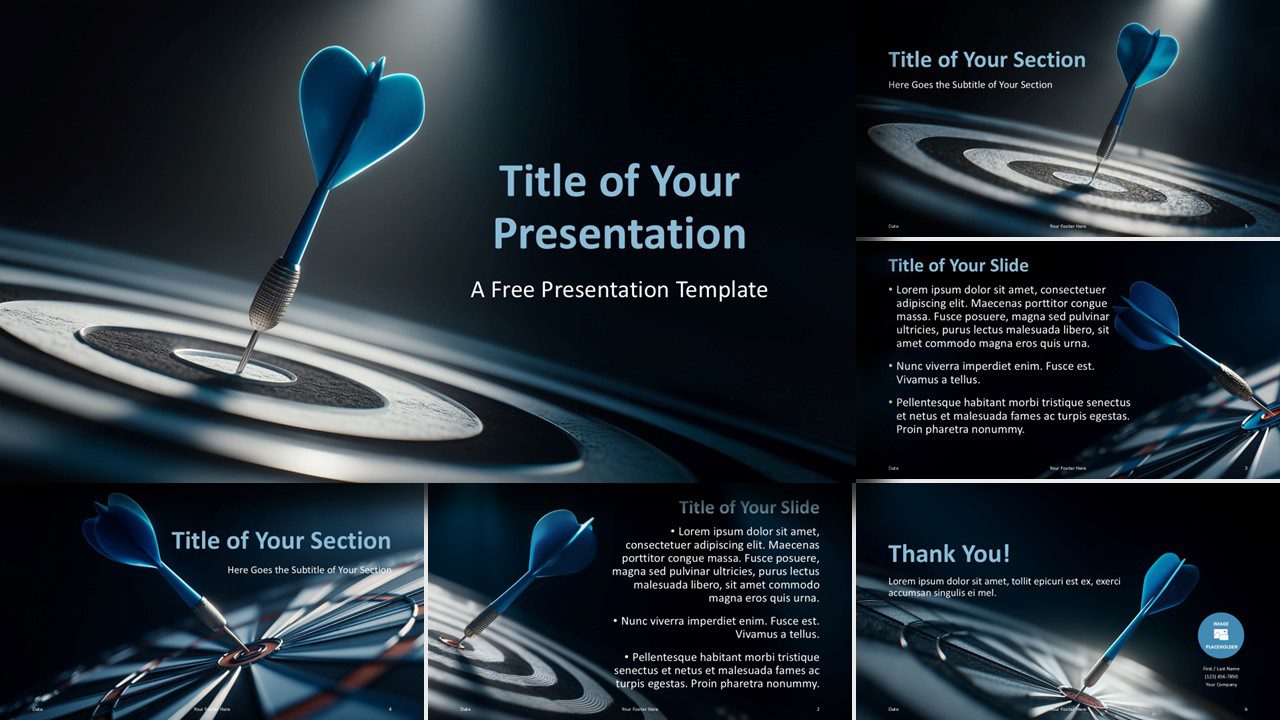
Bullseye Strategy Template
Deliver impactful business presentations with this strategic and goal-oriented template.
Google Slides, POTX
16:9
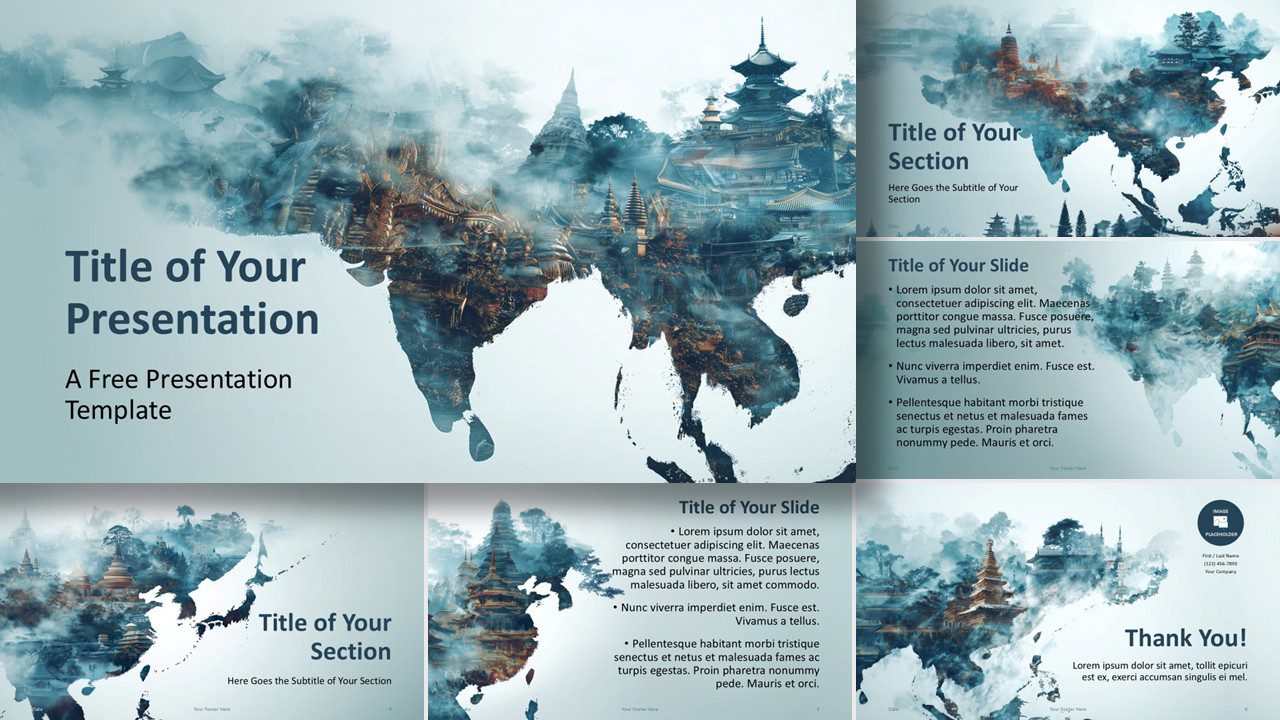
Mystic Asia Template
A stunning Asia-inspired template for modern, cultural, and professional presentations.
Google Slides, POTX
16:9
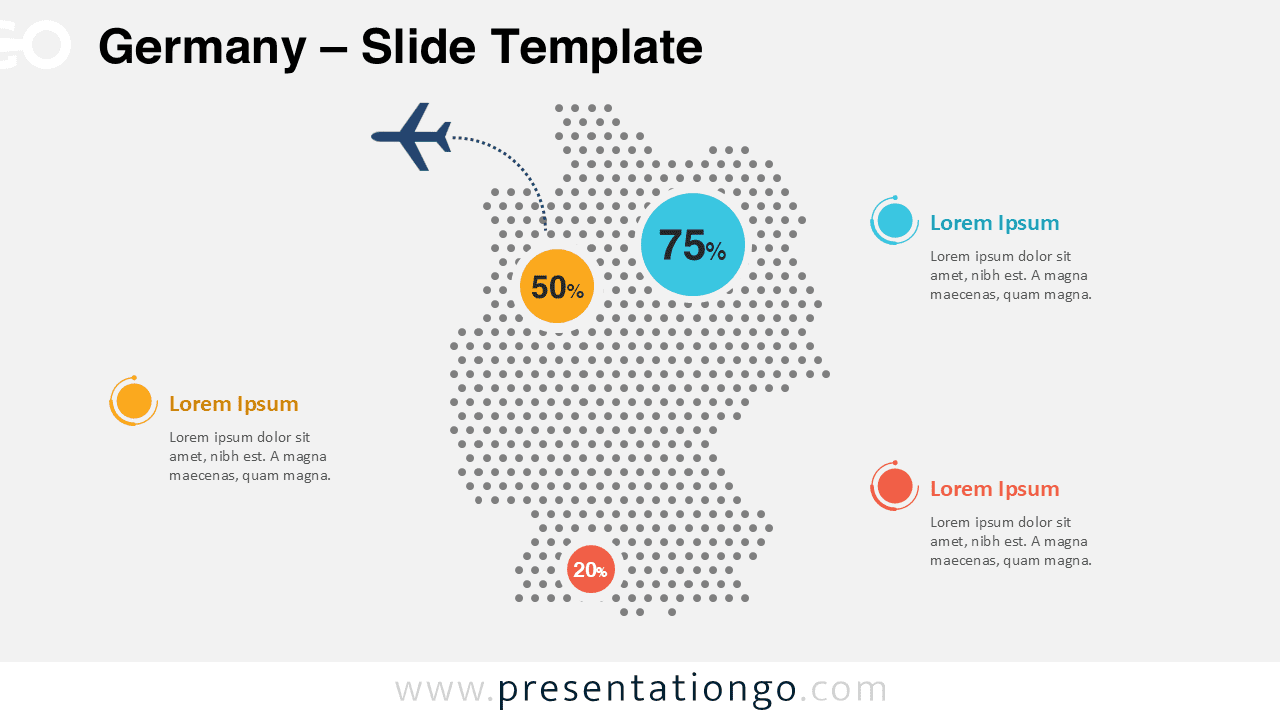
Germany Dotted Map Infographic
Download this Germany dotted map infographic for PowerPoint and Google Slides. Highlight regional data, statistics, and business insights with editable markers.
Google Slides, PPTX
16:9
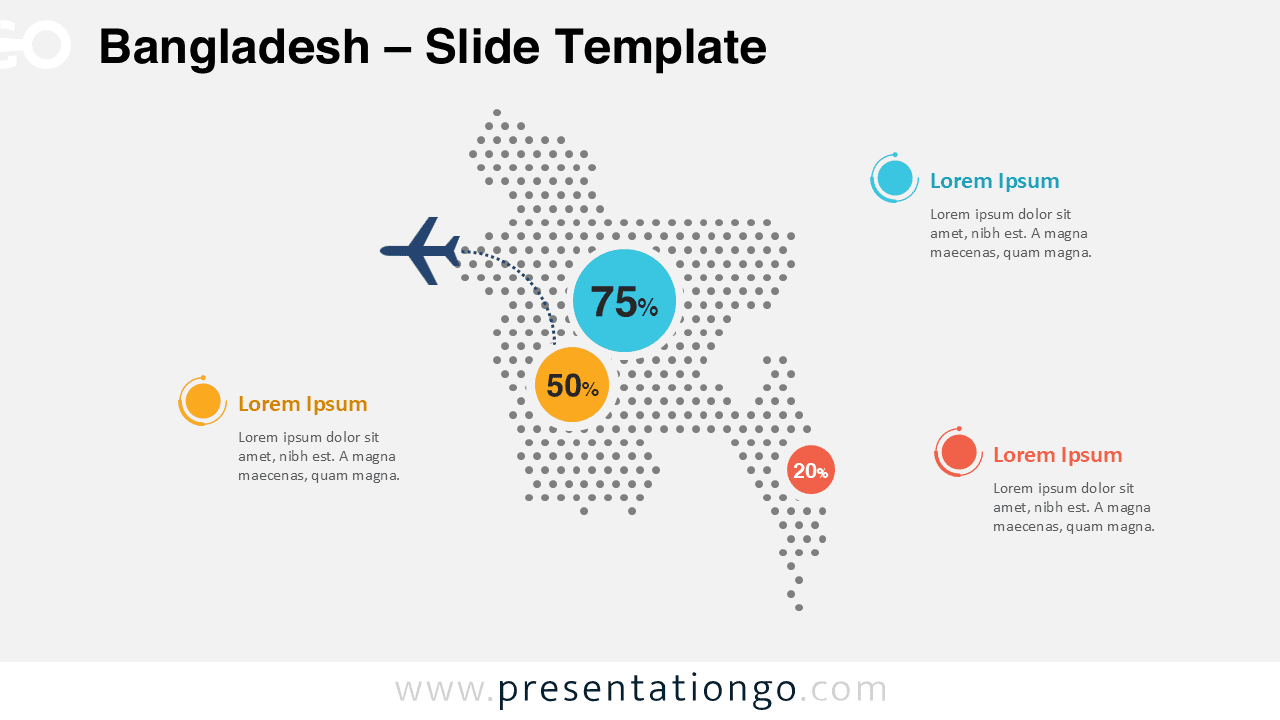
Bangladesh Dotted Map Infographic
Download a clean Bangladesh dotted map infographic for PowerPoint and Google Slides. Perfect for visualizing geographic data and regional statistics.
Google Slides, PPTX
16:9
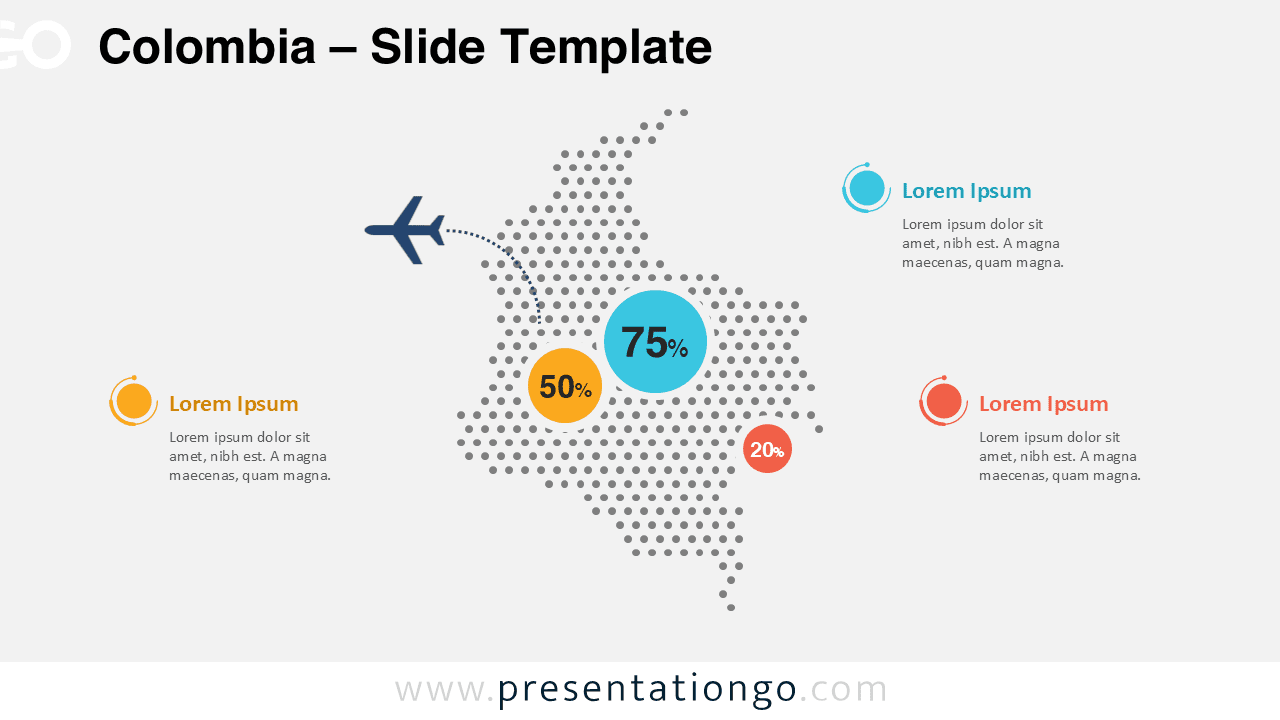
Colombia Dotted Map Infographic
Use this Colombia Dotted Map Infographic to present geographic insights, statistics, and regional analysis in PowerPoint and Google Slides with a modern dotted map design.
Google Slides, PPTX
16:9
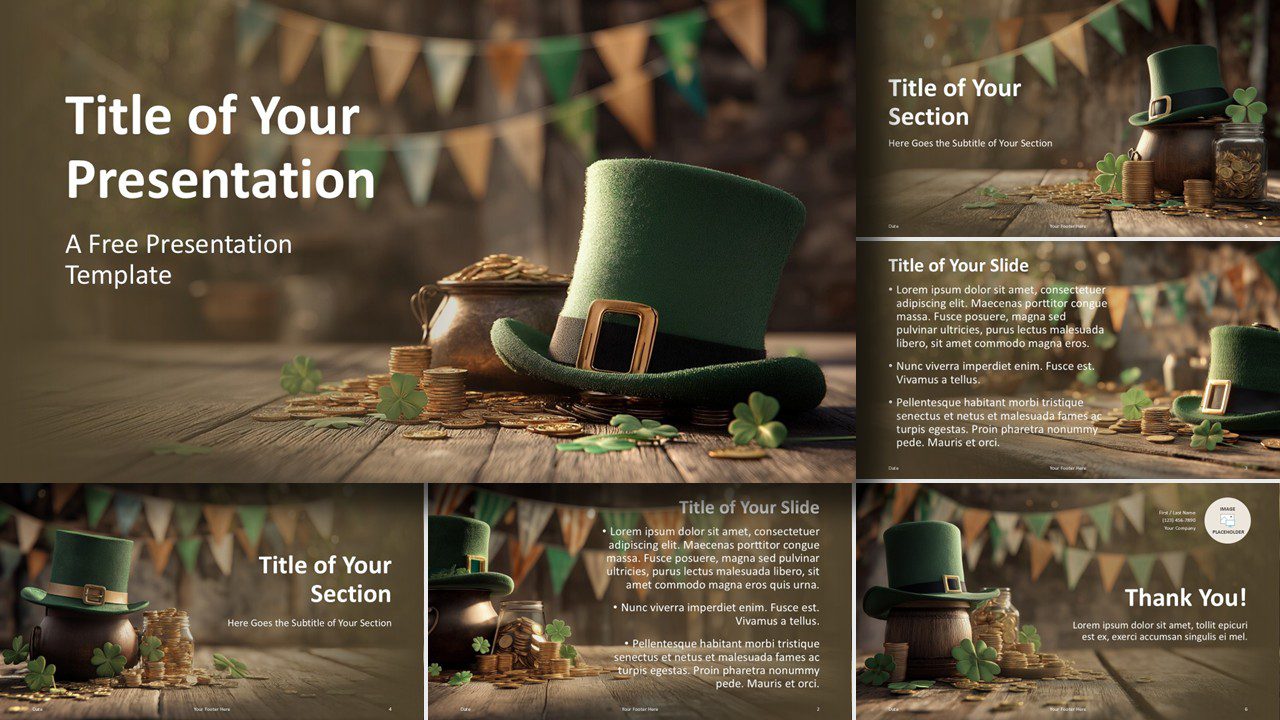
Pot of Gold Template
Pot of Gold template with festive green visuals and gold accents for PowerPoint and Google Slides. Ideal for themed and St. Patrick’s Day presentations.
Google Slides, POTX
16:9
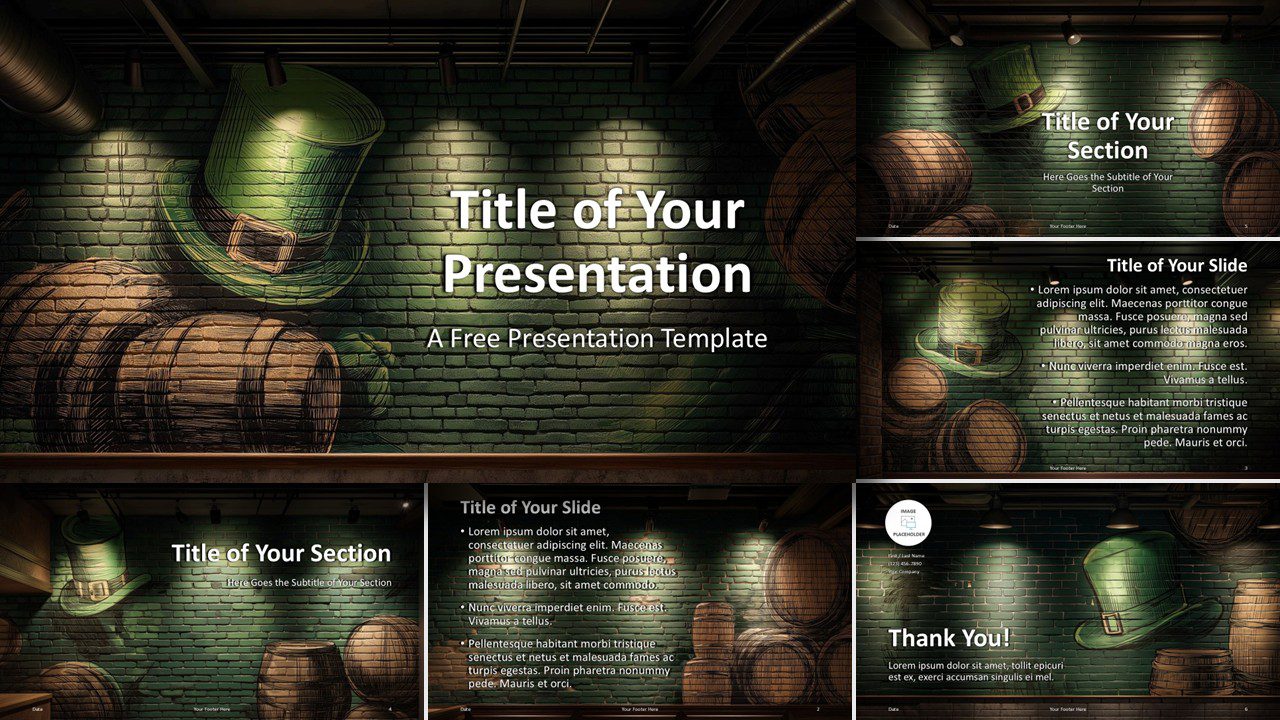
Brick & Barrel Irish Pub Template
Rustic Irish pub themed presentation template with brick wall textures, barrels, and festive lighting. Perfect for PowerPoint and Google Slides.
Google Slides, POTX
16:9
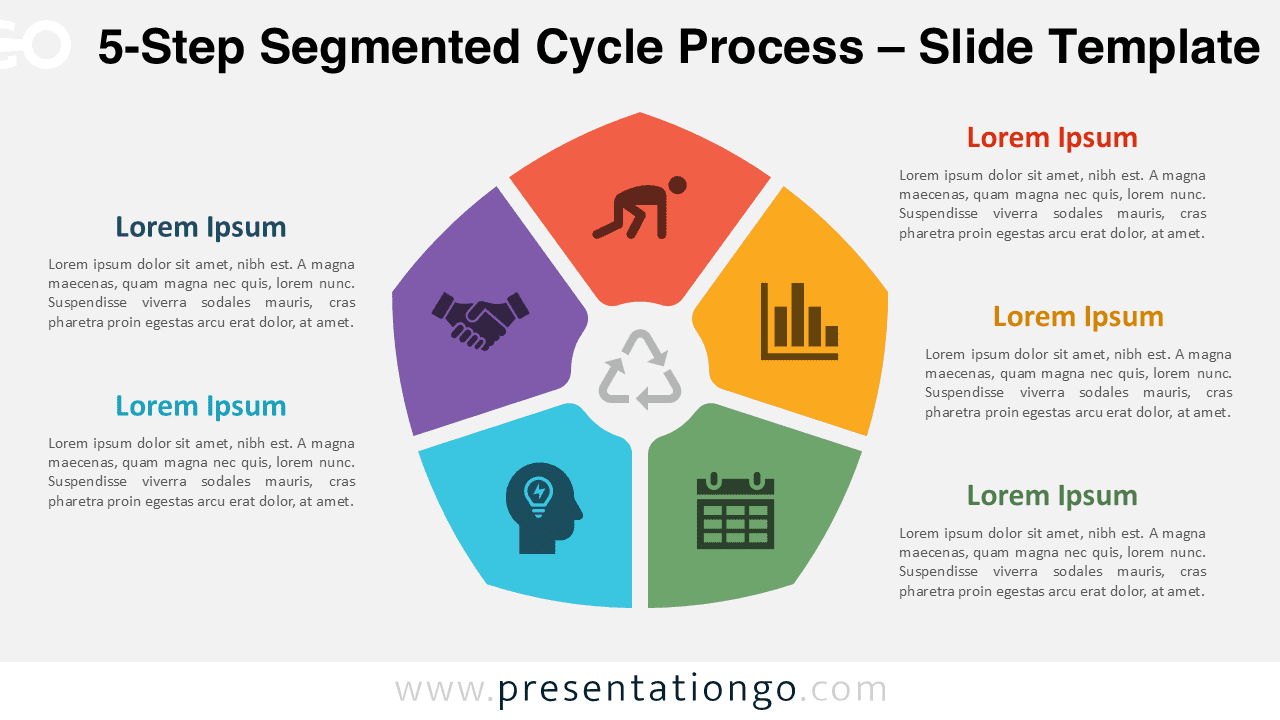
5-Step Segmented Cycle Process
Download this free 5-Step Segmented Cycle Process diagram for PowerPoint and Google Slides to illustrate workflows, strategy frameworks, and iterative processes.
Google Slides, PPTX
16:9
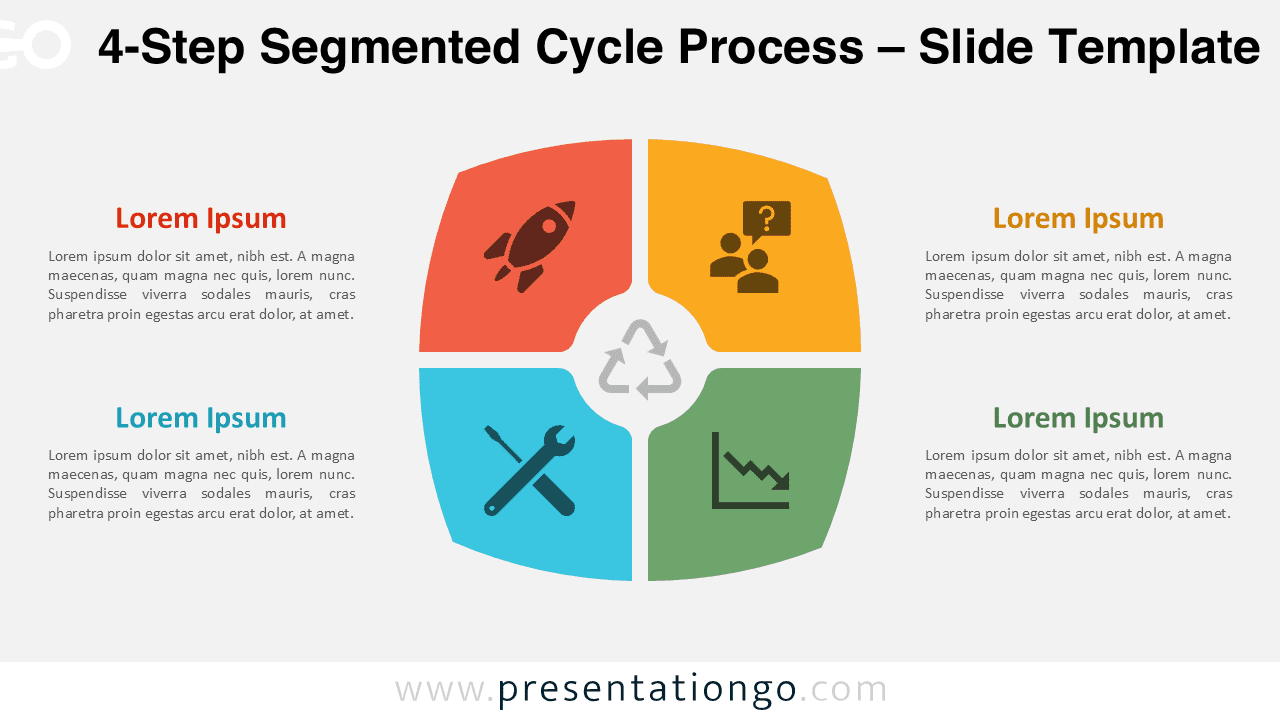
4-Step Segmented Cycle Process
Download this free 4-Step Segmented Cycle Process diagram for PowerPoint and Google Slides to illustrate workflows, strategies, and continuous improvement cycles.
Google Slides, PPTX
16:9
