Latest Templates
Discover our vast, continually growing collection of free, high-quality, customizable templates & Infographics for PowerPoint and Google Slides presentations, designed to enhance your visual communication.
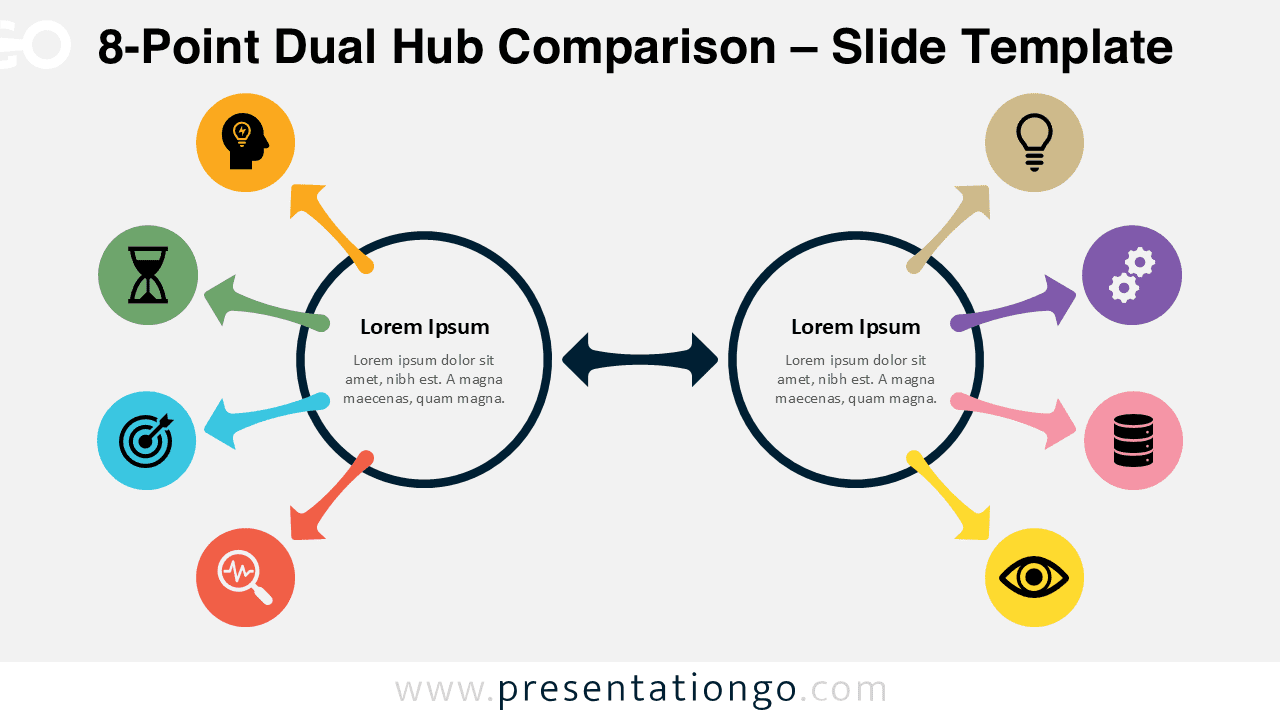
8-Point Dual Hub Comparison
A structured 8-point dual hub comparison diagram for PowerPoint and Google Slides.
Google Slides, PPTX
16:9
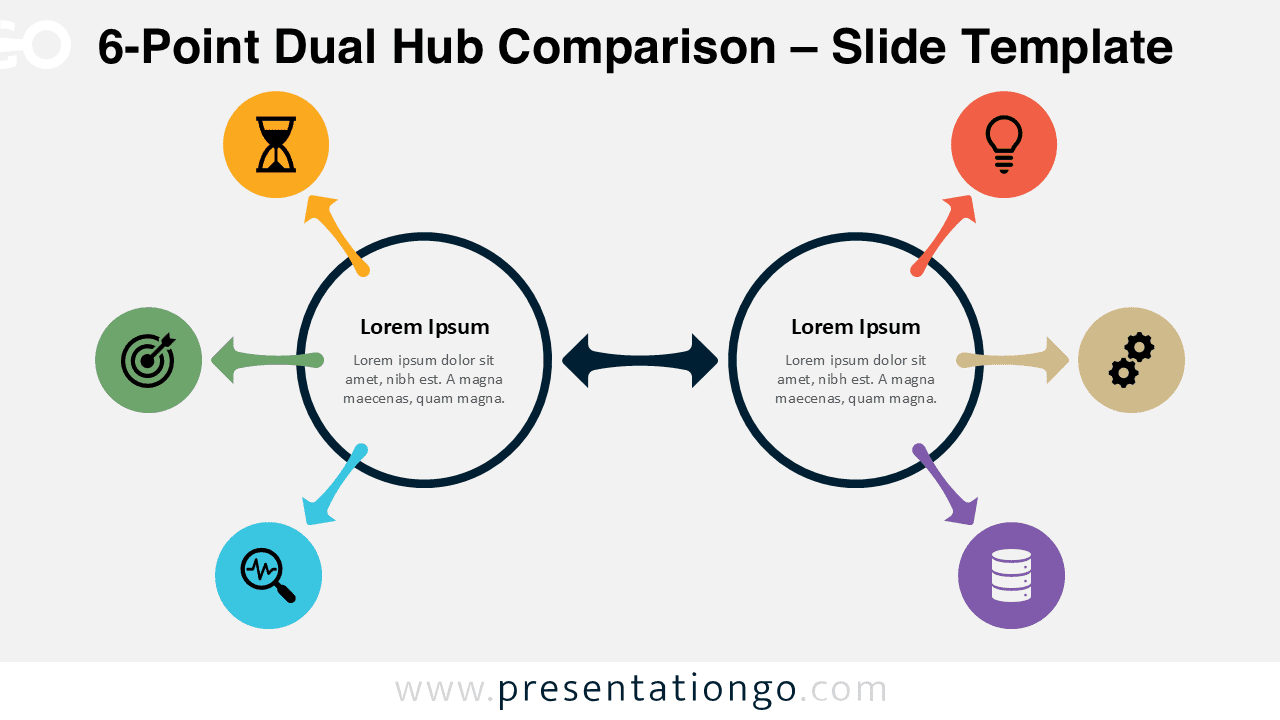
6-Point Dual Hub Comparison
Present dual processes clearly with this 6-point radial comparison diagram.
Google Slides, PPTX
16:9
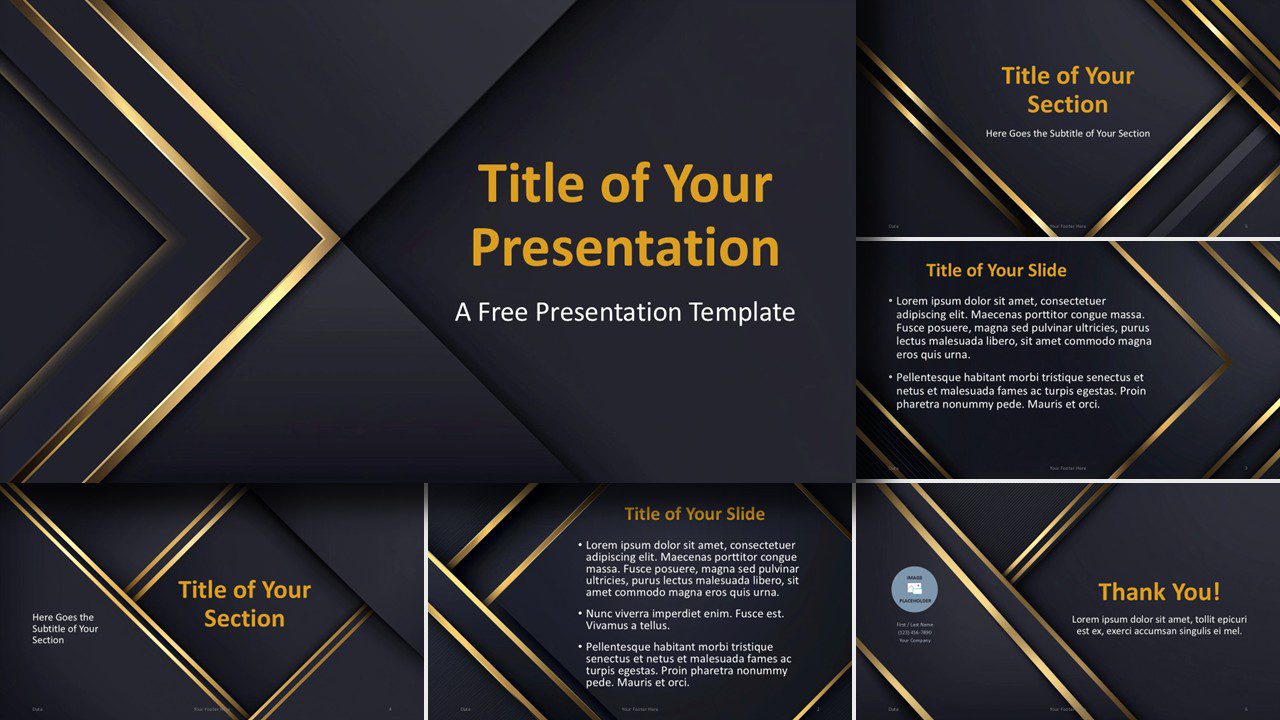
Golden Edge Template
Elegant dark presentation template with gold accents for professional high-end PowerPoint and Google Slides decks.
Google Slides, POTX
16:9
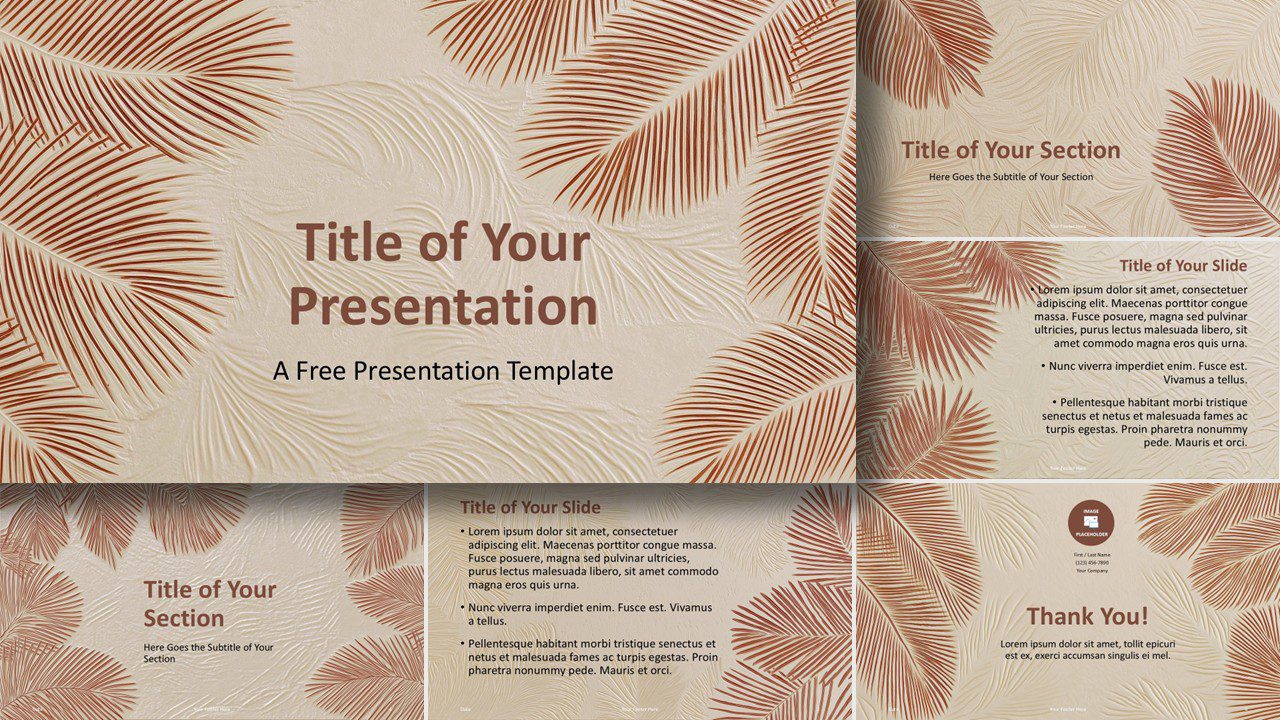
Tropical Serenity Template
A calm and elegant tropical presentation template with palm leaf textures and warm earthy tones.
Google Slides, POTX
16:9
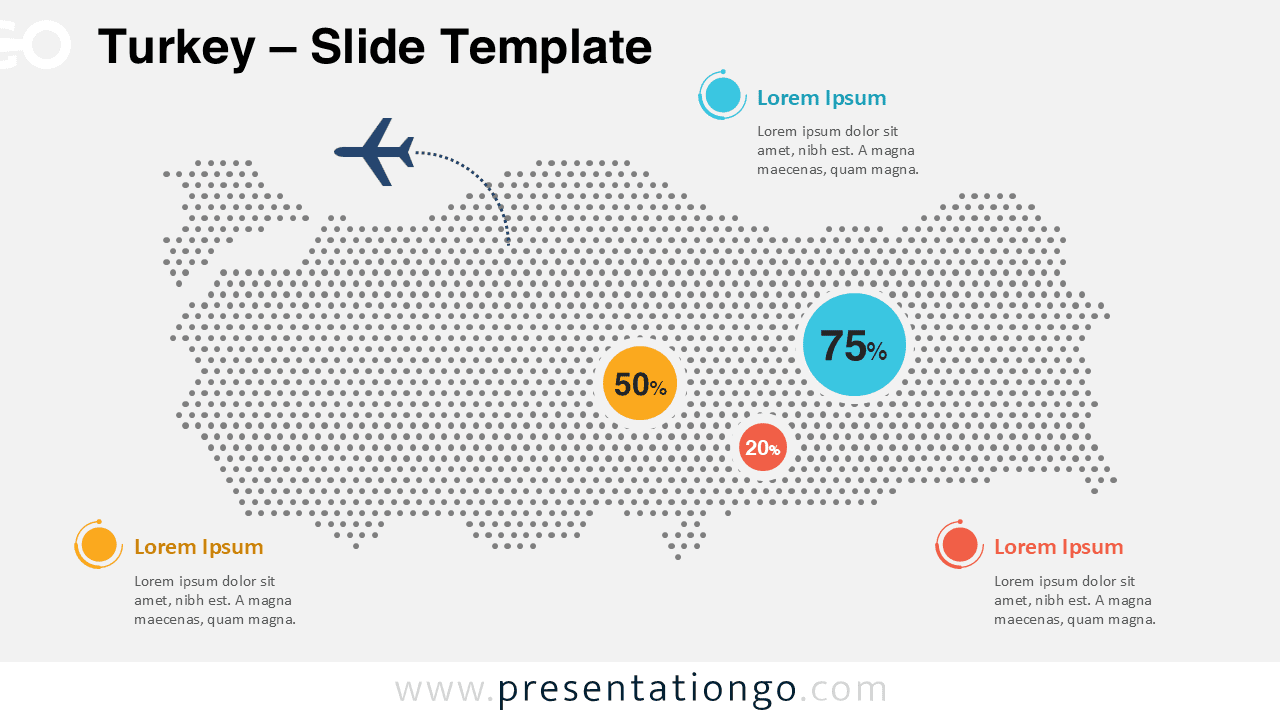
Turkey Dotted Map Infographic
Visualize geographic insights with this Turkey Dotted Map Infographic for PowerPoint and Google Slides featuring editable elements and a modern dotted design.
Google Slides, PPTX
16:9
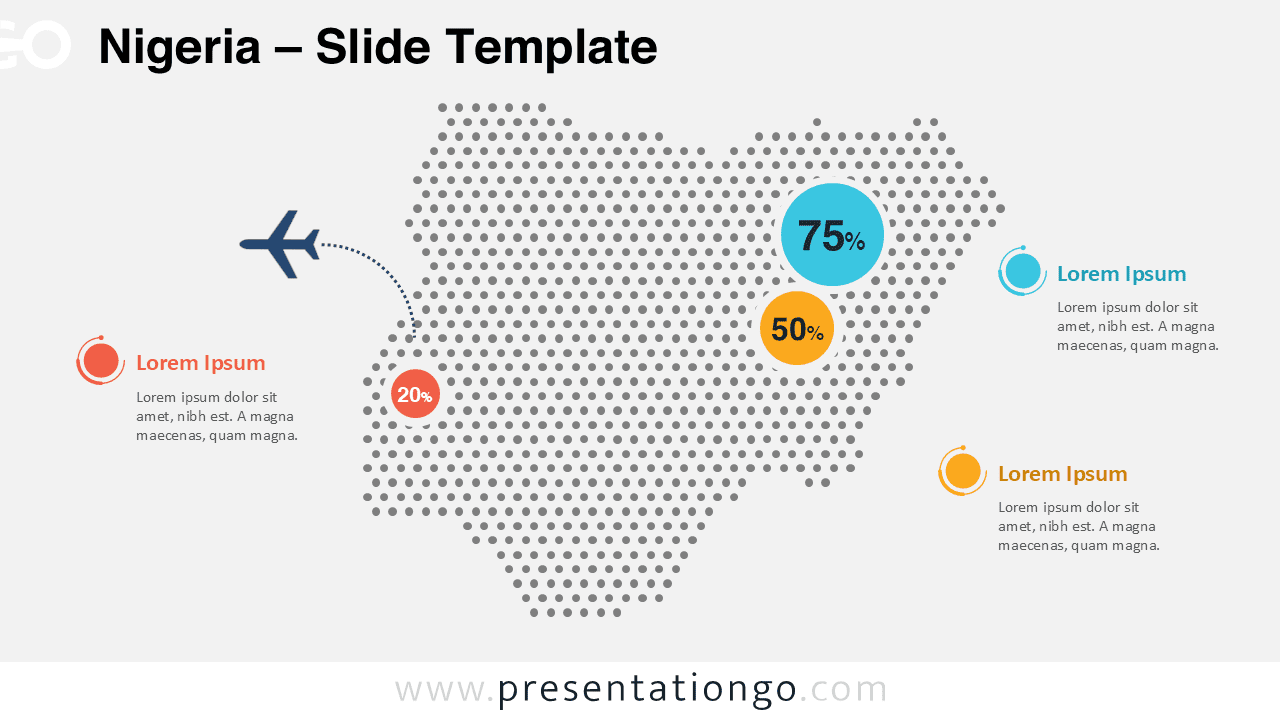
Nigeria Dotted Map Infographic
A modern Nigeria dotted map design for PowerPoint and Google Slides, perfect for presenting regional insights and location-based information.
Google Slides, PPTX
16:9
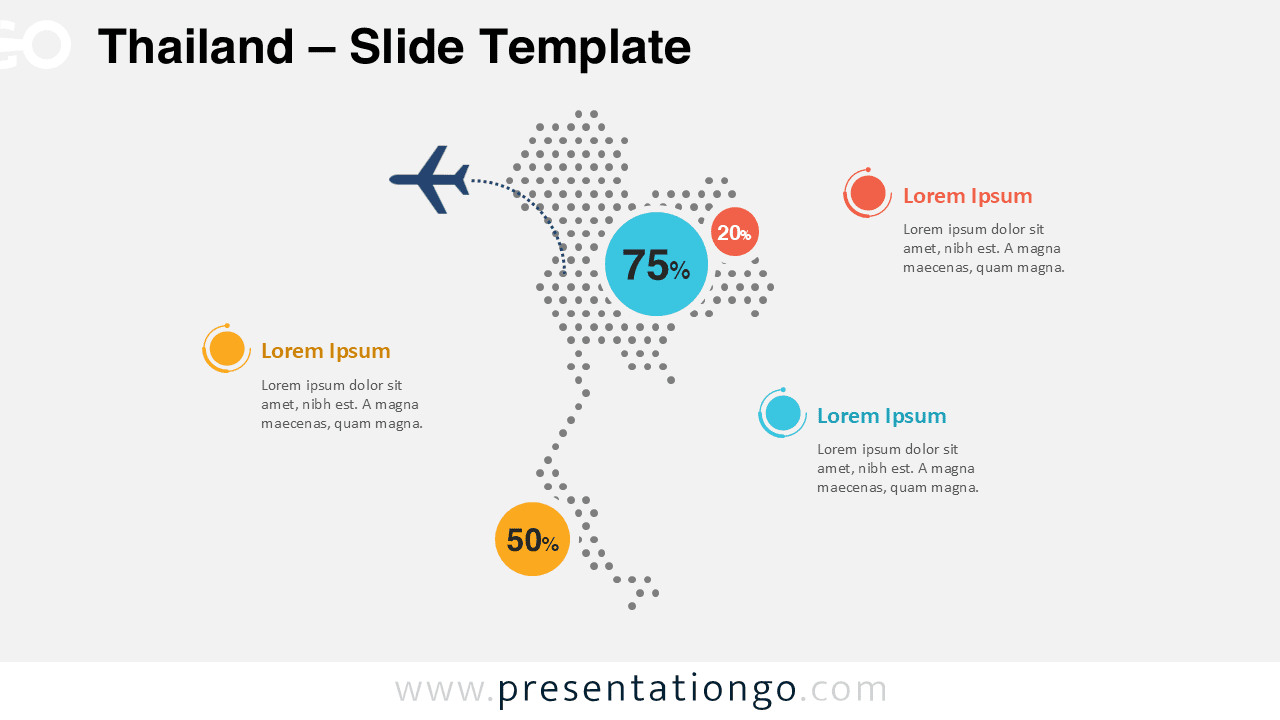
Thailand Dotted Map Infographic
Editable Thailand dotted map infographic for PowerPoint and Google Slides. Ideal for tourism, market analysis, geographic data, and regional insights.
Google Slides, PPTX
16:9
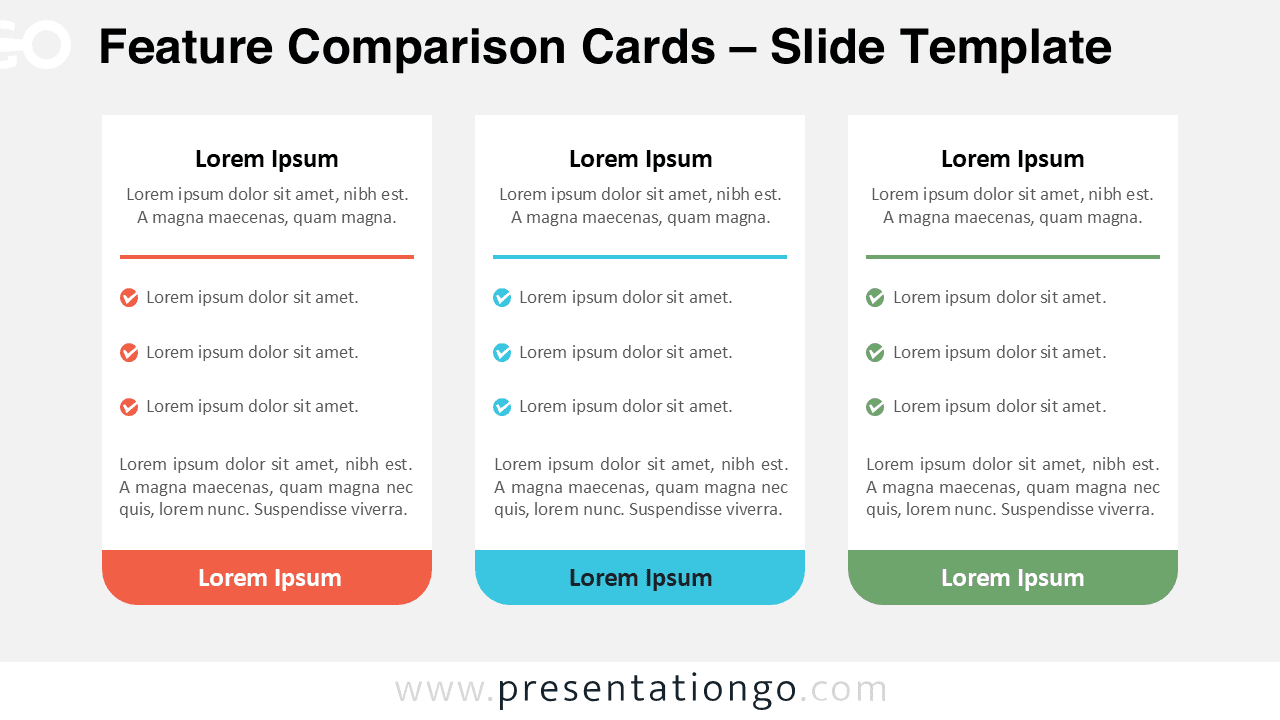
Feature Comparison Cards
Compare features, pricing plans, or services using clean card layouts for PowerPoint and Google Slides presentations.
Google Slides, PPTX
16:9
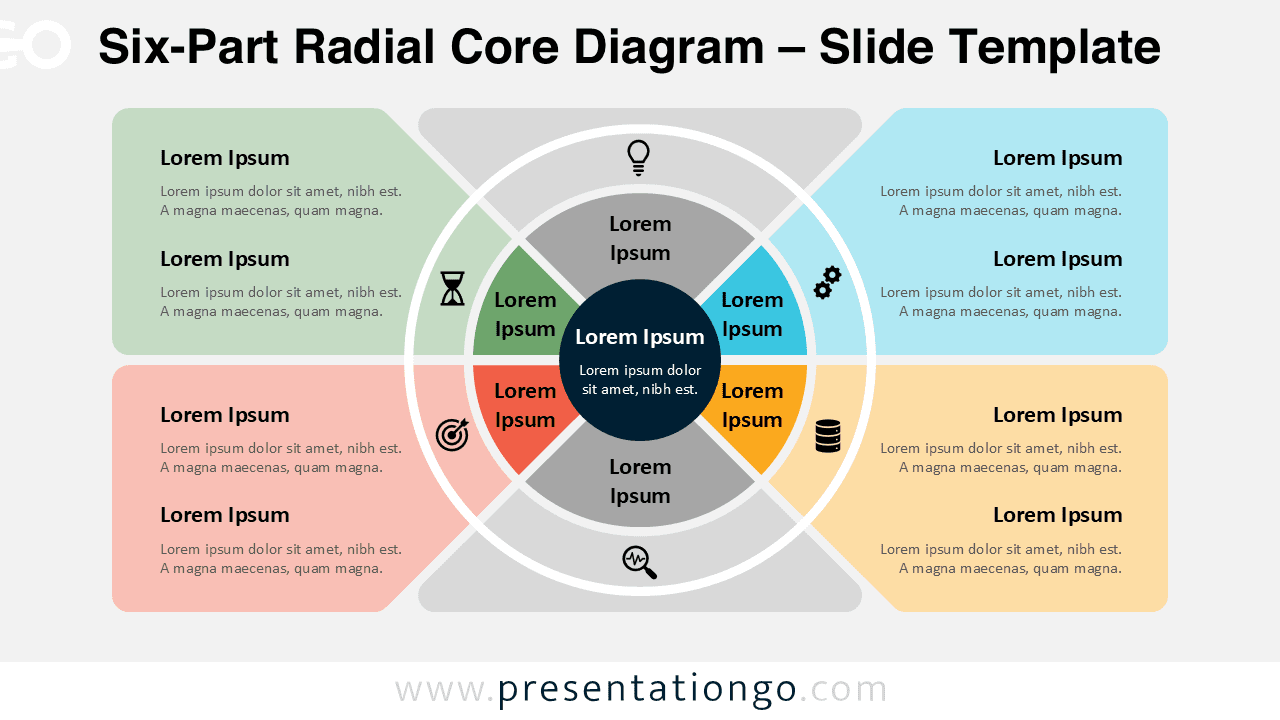
Six-Part Radial Core Diagram
A six-part radial diagram, ideal for complex frameworks and multi-step processes in PowerPoint and Google Slides.
Google Slides, PPTX
16:9
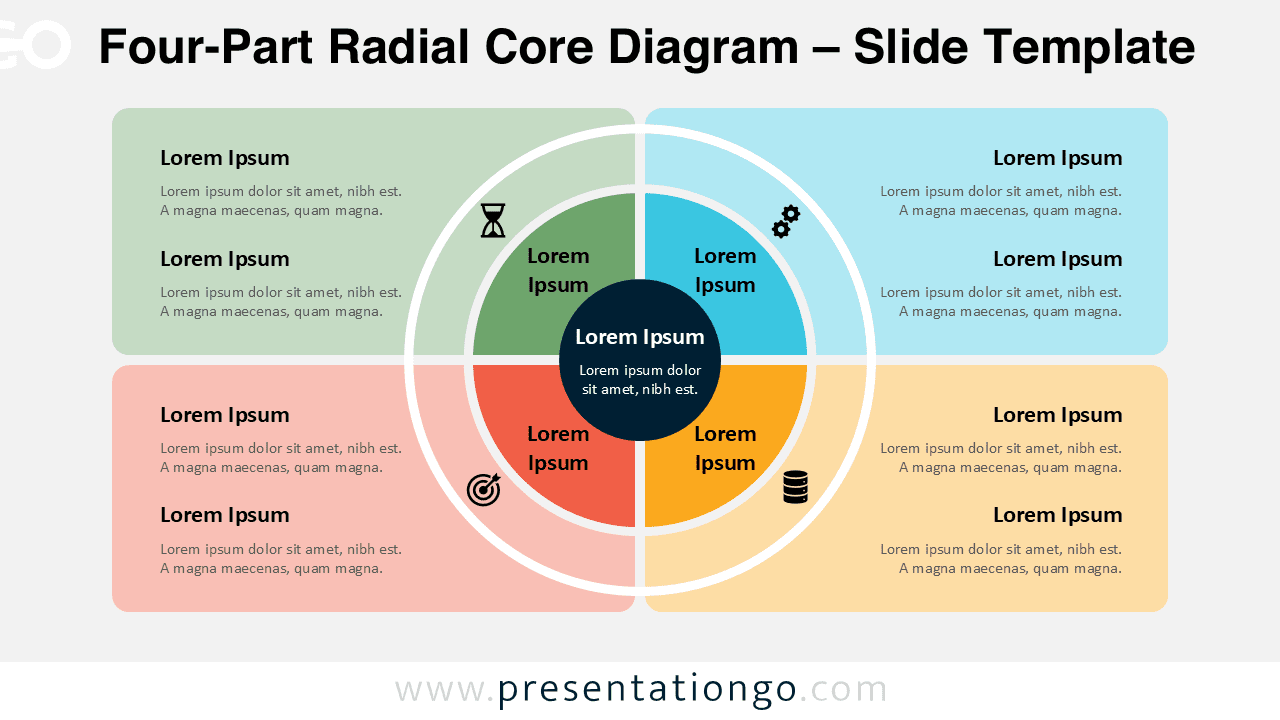
Four-Part Radial Core Diagram
Present four key ideas in PowerPoint and Google Slides with this modern radial core diagram design.
Google Slides, PPTX
16:9
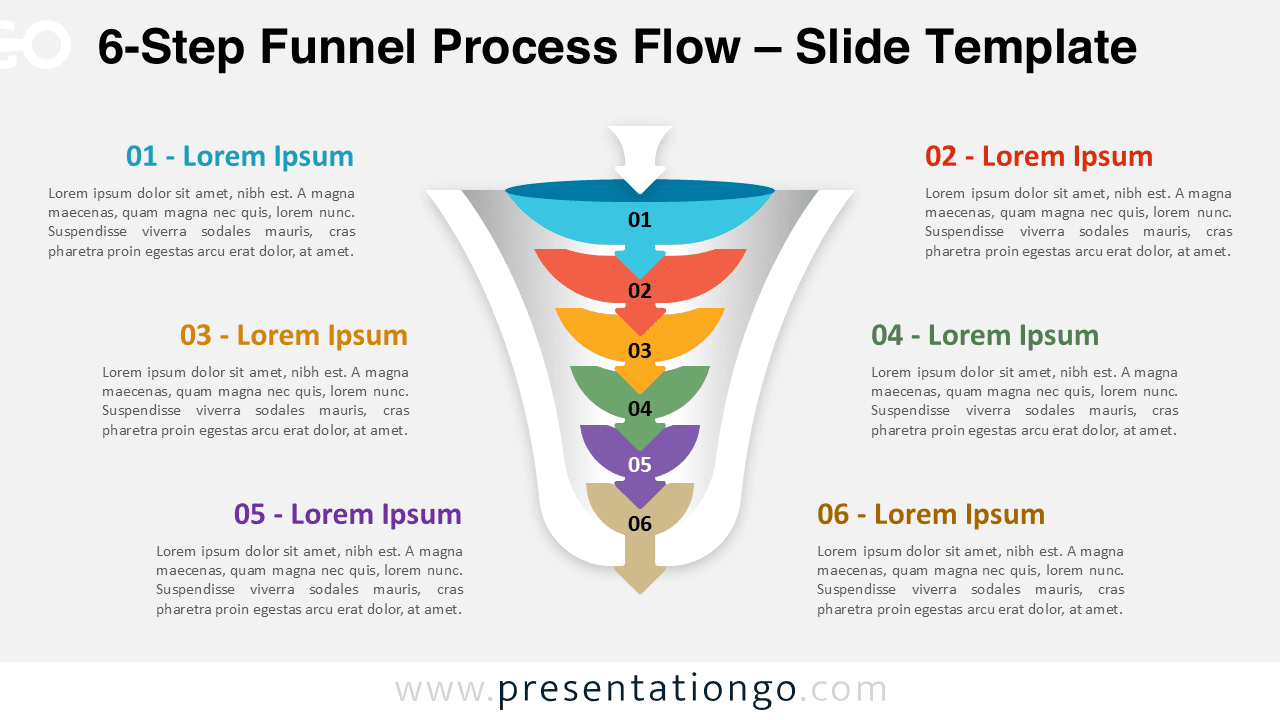
6-Step Funnel Process Flow
Present complex sales funnels or end-to-end customer journeys with this 6-step funnel process flow diagram for PowerPoint.
Google Slides, PPTX
16:9
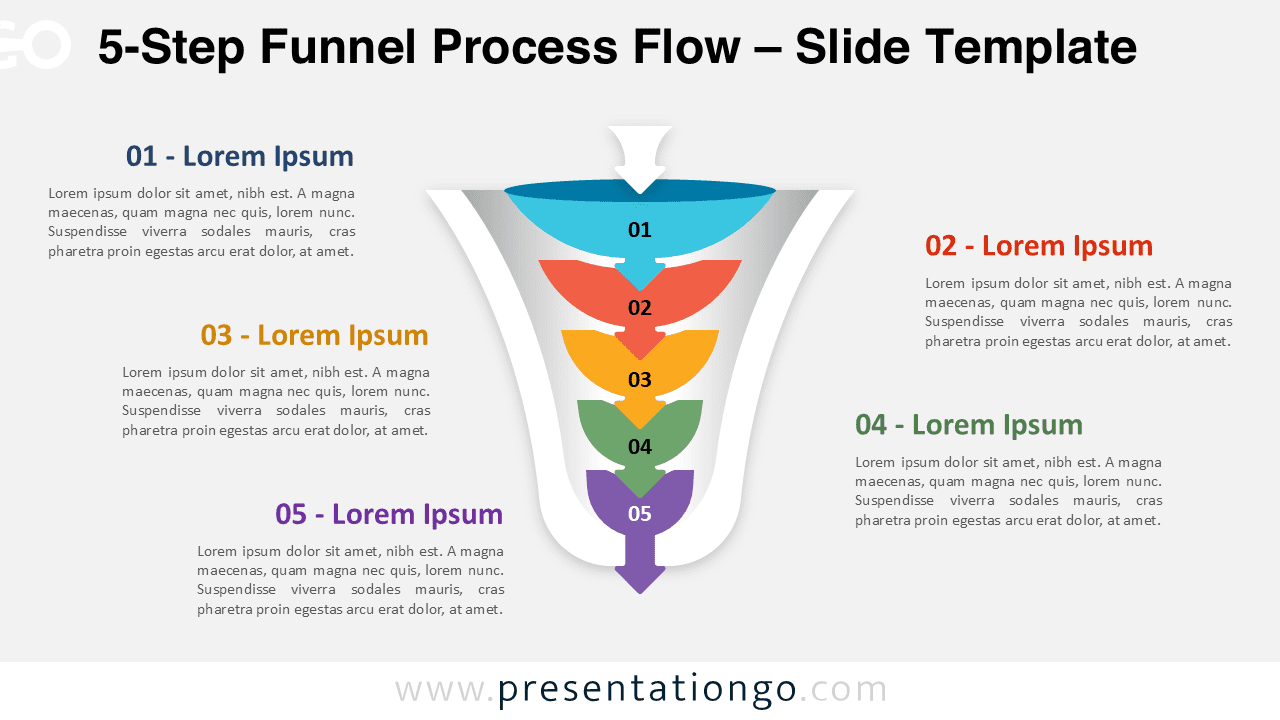
5-Step Funnel Process Flow
Break down detailed marketing funnels or customer journeys with this 5-step funnel process flow diagram for PowerPoint.
Google Slides, PPTX
16:9
