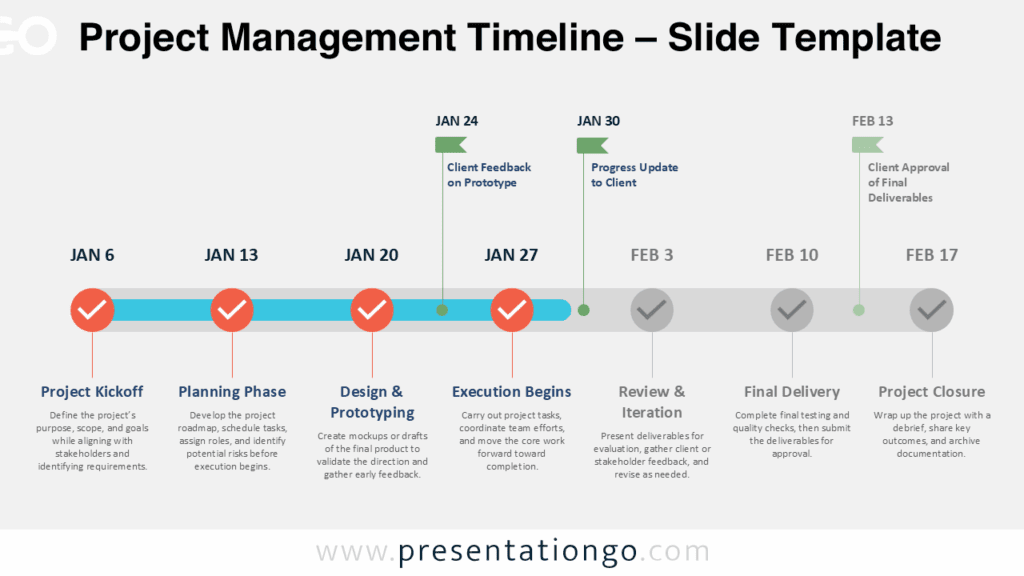
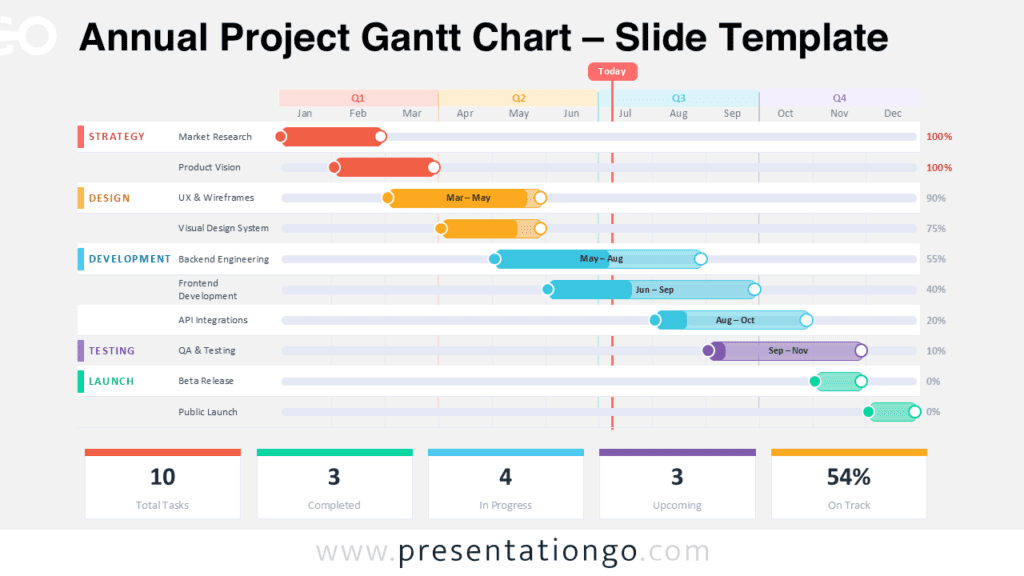
The Project Time Plan diagram helps teams present schedules with clarity and confidence. It uses a Gantt-style layout to connect phases, months, milestones, and delivery checkpoints. You can use it in PowerPoint and Google Slides for planning, reporting, and alignment.
The design includes two visual versions, so you can match different presentation themes while keeping the same structured project planning format.
Diagram Preview


Diagram Features and Customization Options
- Editable timeline bars for project phases, tasks, and deliverables.
- Month-based planning axis.
- Clear “Today” marker for status updates and progress reviews.
- Color-coded rows for workstreams, teams, or responsibility areas.
- Legend area that links each color to its project phase.
- Two theme versions for flexible presentation contexts.
- Easy text editing for labels, dates, descriptions, and status notes.
- Designed for PowerPoint and Google Slides.
Design and Structure
The layout combines a fixed phase list with a horizontal monthly calendar. Each row represents a project phase, such as research, planning, execution, or handover. Colored bars show duration and timing, while short labels describe key activities.
The vertical marker highlights the current date and supports progress discussions. Alternating row shading improves scanning and keeps the schedule readable. The palette balances professional navy tones with energetic accent colors.
This contrast helps viewers identify responsibilities, overlaps, and deadlines quickly. Because project timelines often involve multiple owners, the diagram separates each workstream into its own row. This structure helps audiences follow dependencies without reading long status reports.
You can adapt month labels, phase names, and bar lengths to match any project duration. The design also supports quick comparison between early discovery tasks and late delivery work.
Practical Applications
- Build project roadmaps for internal teams and stakeholders.
- Present launch plans, consulting timelines, or implementation schedules.
- Compare planned phases with current progress during status meetings.
- Coordinate responsibilities across departments, vendors, and project owners.
- Summarize milestones for executive updates and client presentations.
- Explain handovers, approvals, risk reviews, and final delivery checkpoints.
Summary
The Project Time Plan diagram gives presenters a clear way to explain project progress. It turns complex schedules into a concise visual story. Use it to align teams, show next steps, and support better planning decisions.