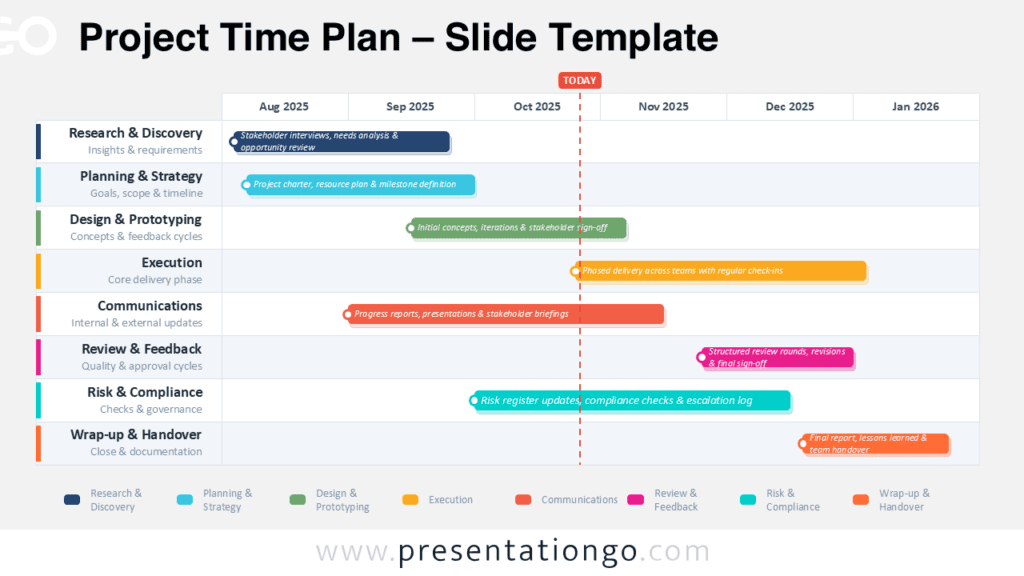
The Project Timeline Gantt Chart helps you present multiple project schedules in one clear view. It works well for PowerPoint and Google Slides. Use it to compare durations, show overlaps, and explain deadlines fast.
This editable diagram gives teams a simple way to track work across twelve months. Each project appears on its own row. The timeline lets viewers understand timing without reading dense project notes.
Diagram Preview


Diagram Features and Customization Options
- Editable project labels for clear task or workstream naming.
- Five horizontal project tracks for schedule comparison.
- Monthly timeline markers from January to December.
- Customizable bars for phases, durations, or milestones.
- Compatible with PowerPoint and Google Slides.
- Easy to adapt for business, education, or planning meetings.
Design and Structure
The Project Timeline Gantt Chart uses a structured horizontal layout. The left side lists project names. The main area displays each schedule on a monthly timeline. This layout helps audiences compare projects at a glance.
The diagram also includes a lower month marker row. This element supports quick reading and adds timing context. You can edit labels, resize bars, and adjust durations to match your own schedule.
Practical Applications
- Present project plans during team meetings.
- Track workstreams across a yearly roadmap.
- Compare campaign schedules and launch phases.
- Explain implementation timelines to clients.
- Organize sprint planning or portfolio updates.
- Show milestone progress in executive reports.
Summary
This Project Timeline Gantt Chart gives presenters a practical planning tool for visual schedules. It helps teams show timing, sequence, and workload distribution with clarity. Download it for PowerPoint and Google Slides to build polished project updates faster.