Sweden Dotted Map Infographic offers a clean and modern way to present geographic information in PowerPoint and Google Slides. The design uses a dotted silhouette of Sweden, bold percentage markers, and simple text areas that stay easy to edit. It helps you turn regional data into a visual story that feels clear, professional, and presentation-ready.
You can replace the sample text with city names, regional notes, business metrics, or travel highlights in minutes. The layout stays focused and readable, which makes it useful for both quick overviews and more detailed location-based presentations.
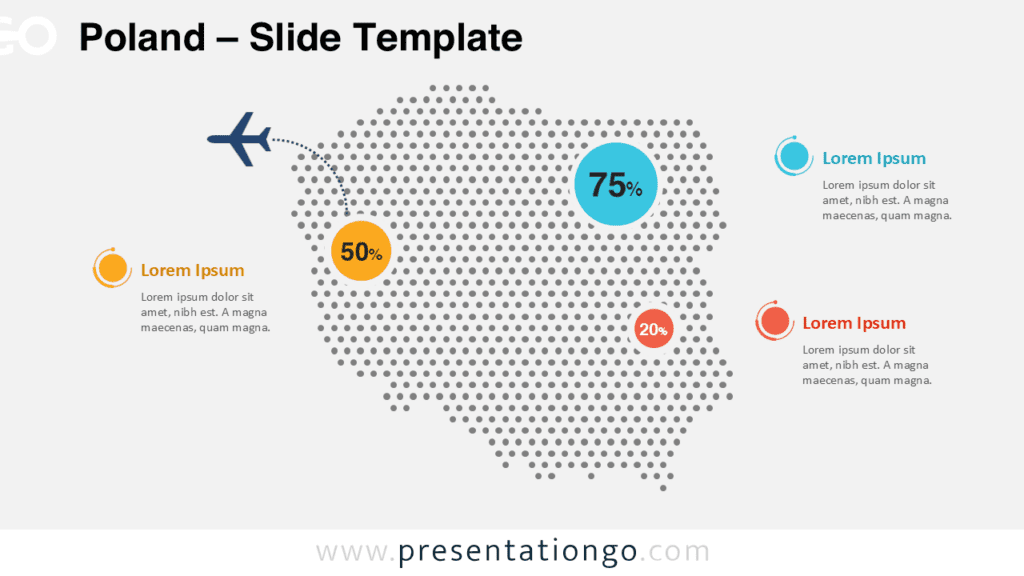
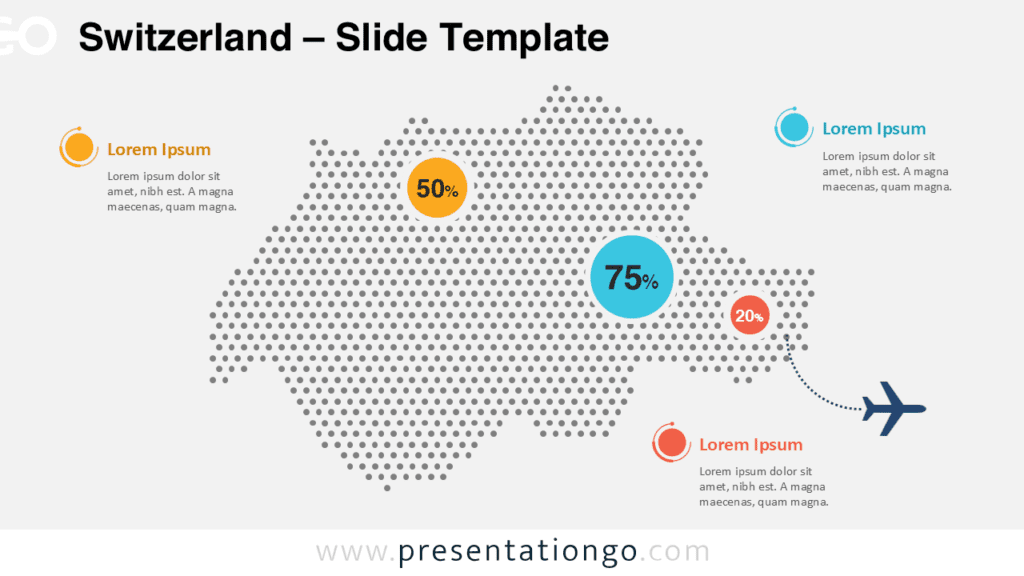
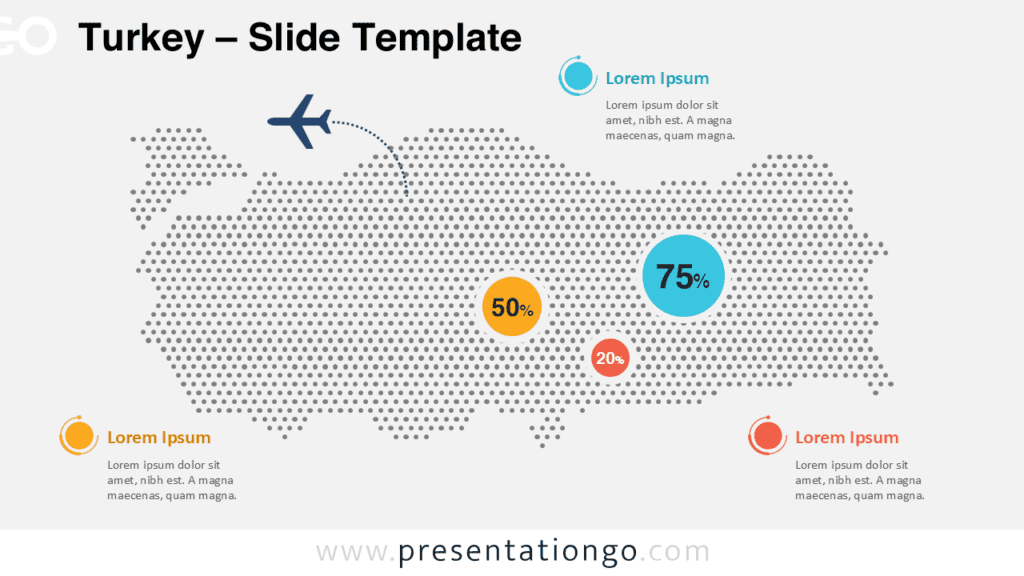
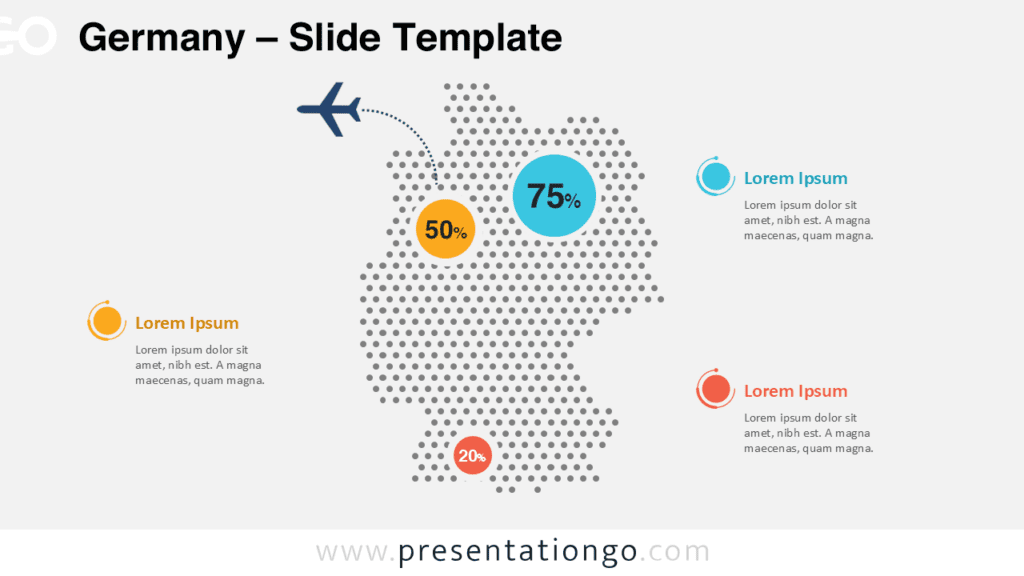
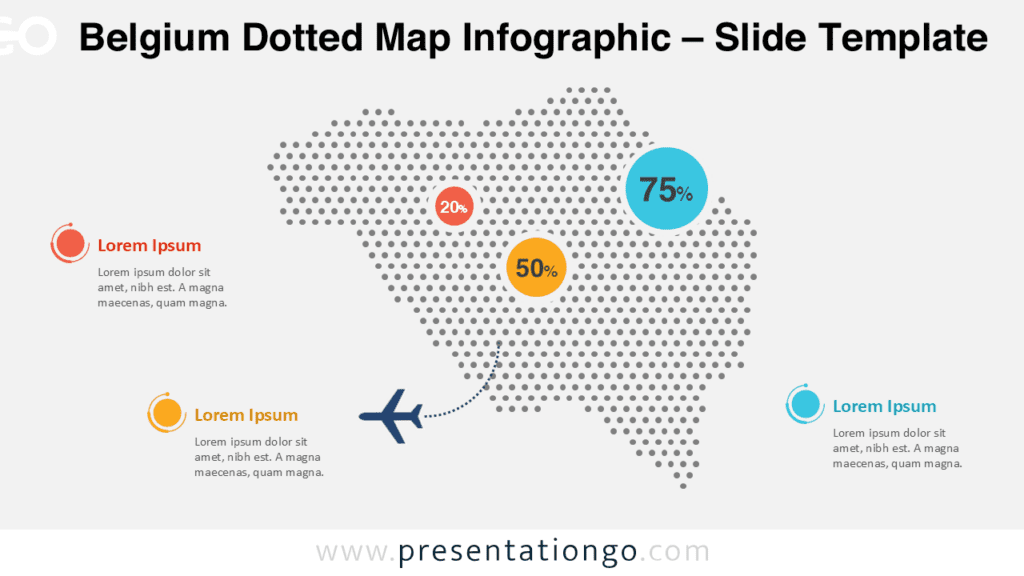
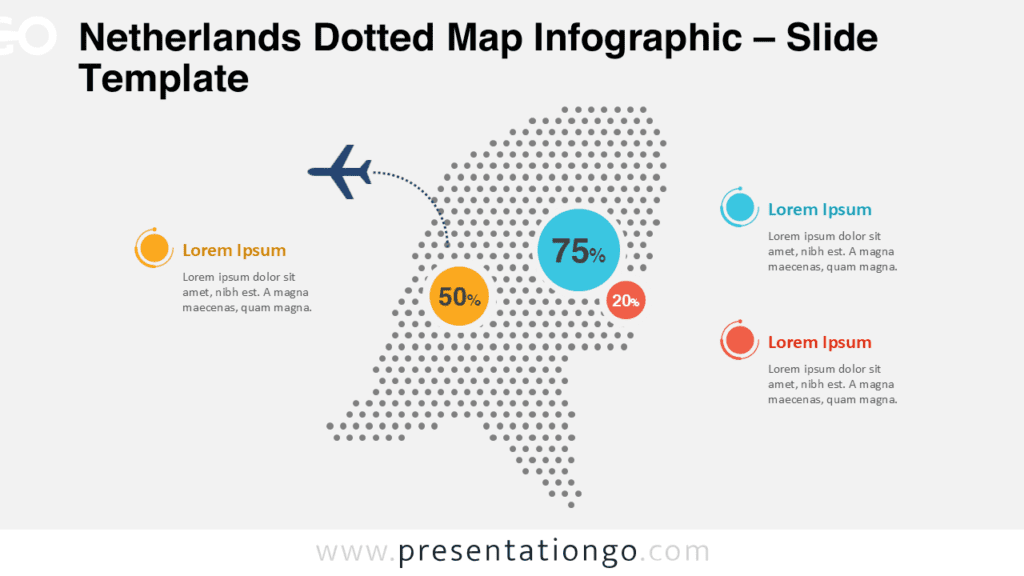
Map Preview


This infographic includes both light and dark versions, so it adapts well to different slide themes and presentation settings. Whether you are presenting in a meeting room, classroom, or conference environment, the structure remains easy to follow and visually balanced.
Features and Customization Options
- Editable dotted map of Sweden with a clear and recognizable country outline.
- Two ready-to-use versions for bright and dark presentation themes.
- Percentage circles and callout areas for data points, comparisons, and highlights.
- Easy editing for text, shapes, dots, and accent elements.
- Useful for tourism, logistics, business expansion, and public reports.
- Simple layout that stays readable on screens, projectors, and printed handouts.
Geographic Coverage
The composition places Sweden at the center and uses surrounding callouts to guide the audience through the information. Large figures communicate the main message fast, while smaller markers support secondary data without creating clutter. The dotted treatment gives the map a modern infographic style while preserving clear country recognition.
Because the layout avoids unnecessary detail, it works well for executive summaries and fast audience scanning. It is especially effective when you want to show nationwide coverage, regional performance, travel routes, or distribution activity in a format that feels structured and easy to understand.
Practical Applications
- Show sales territory coverage or market penetration across Sweden.
- Present tourism flows, air travel links, or transport routes.
- Compare demographic, operational, or service metrics by location.
- Support consulting, education, government, or corporate reporting.
- Introduce Sweden in international business, geography, or travel presentations.
Summary
Sweden Dotted Map Infographic combines geographic clarity with a polished visual style. It helps you explain location-based insights quickly and keeps every element easy to adapt. Use it when you want Sweden-focused data to look modern, structured, and professional in PowerPoint and Google Slides.