Latest Templates
Discover our vast, continually growing collection of free, high-quality, customizable templates & Infographics for PowerPoint and Google Slides presentations, designed to enhance your visual communication.
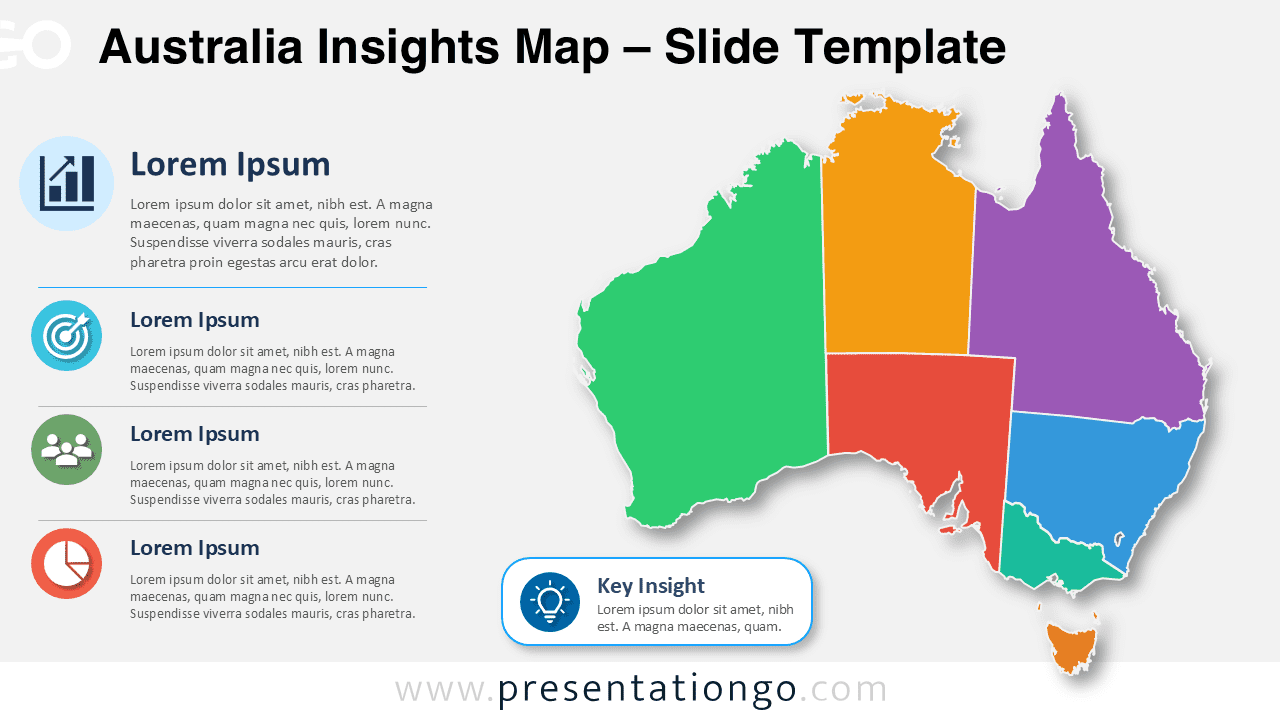
Australia Insights Map
Editable Australia map diagram for regional reports, business insights, and data storytelling in PowerPoint and Google Slides.
Google Slides, PPTX
16:9
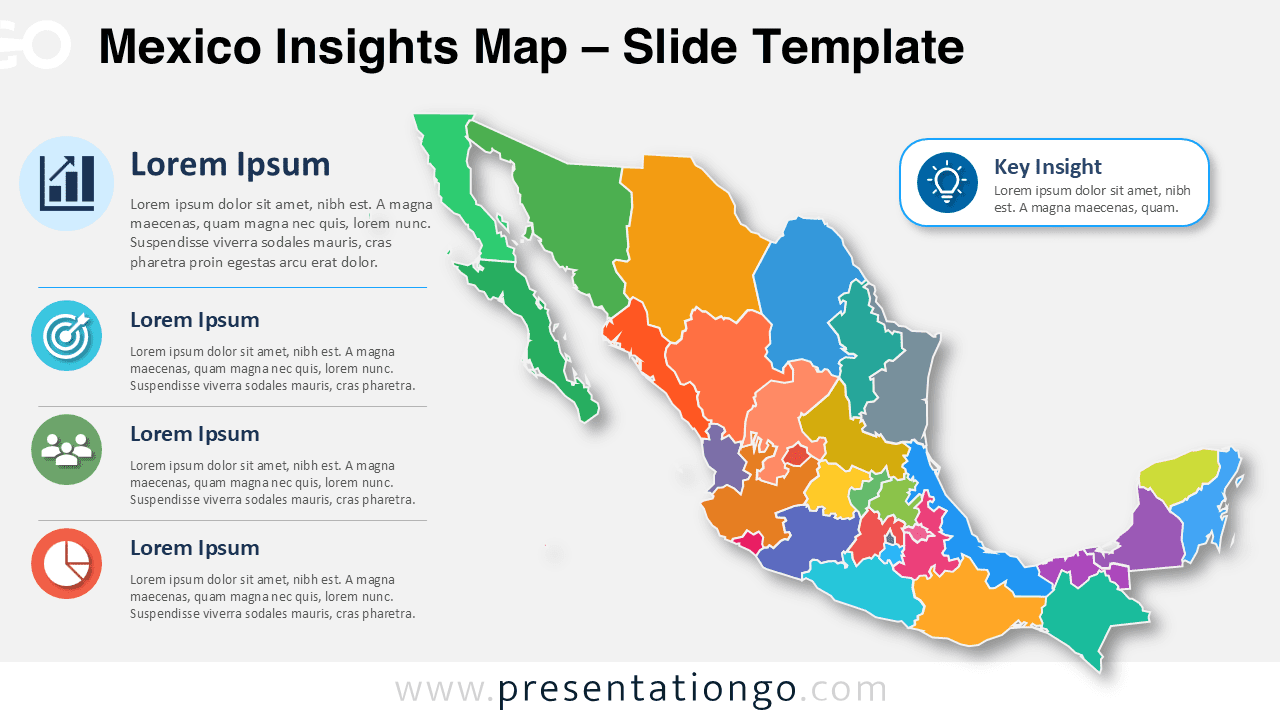
Mexico Insights Map
Editable Mexico Insights Map for PowerPoint and Google Slides with regional sections, callouts, Office icons, and text placeholders for business reports.
Google Slides, PPTX
16:9
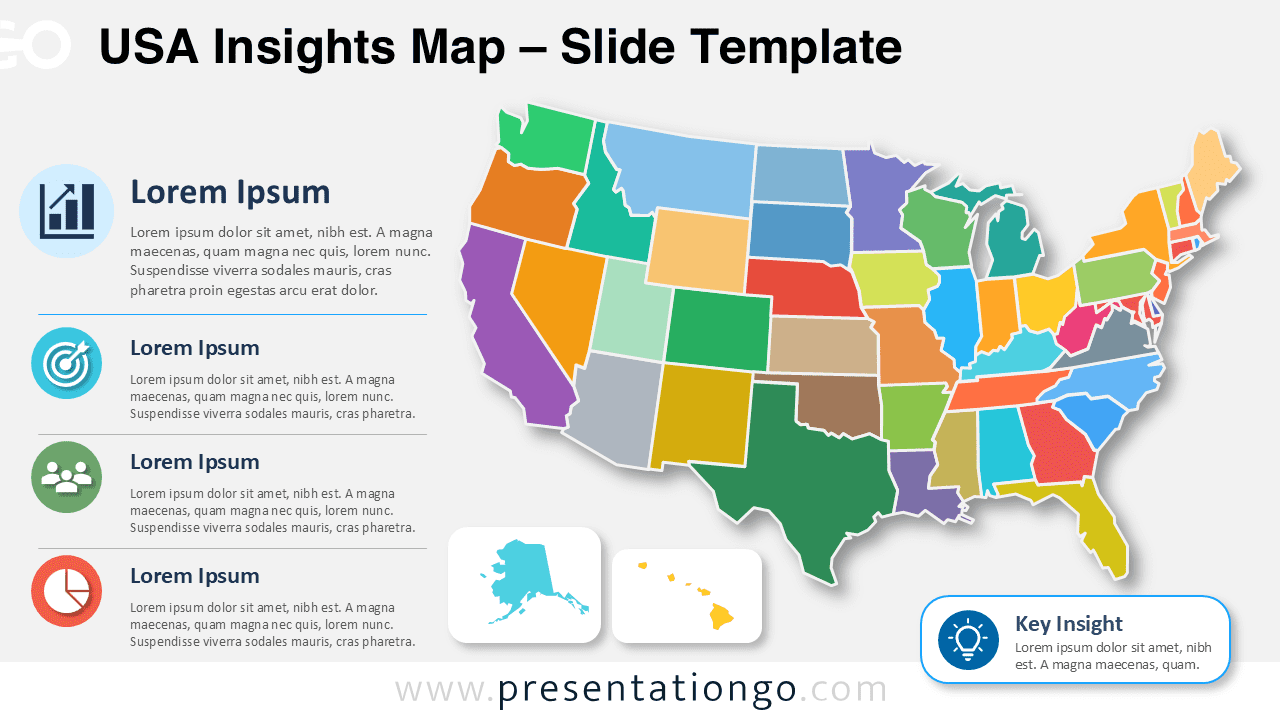
USA Insights Map
Present U.S. regional insights with an editable map, customizable state shapes, Office icons, and ready-made text areas.
Google Slides, PPTX
16:9
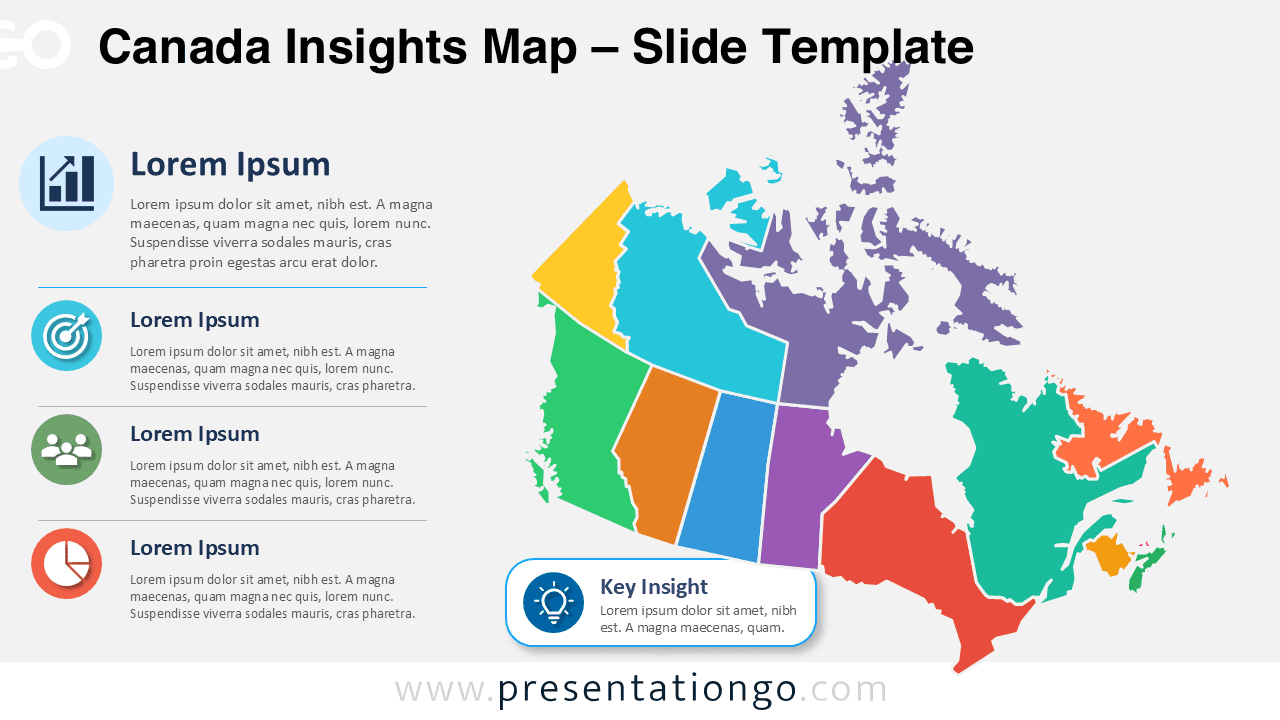
Canada Insights Map
Present Canadian market, policy, education, or sales data with an editable map slide designed for quick customization.
Google Slides, PPTX
16:9
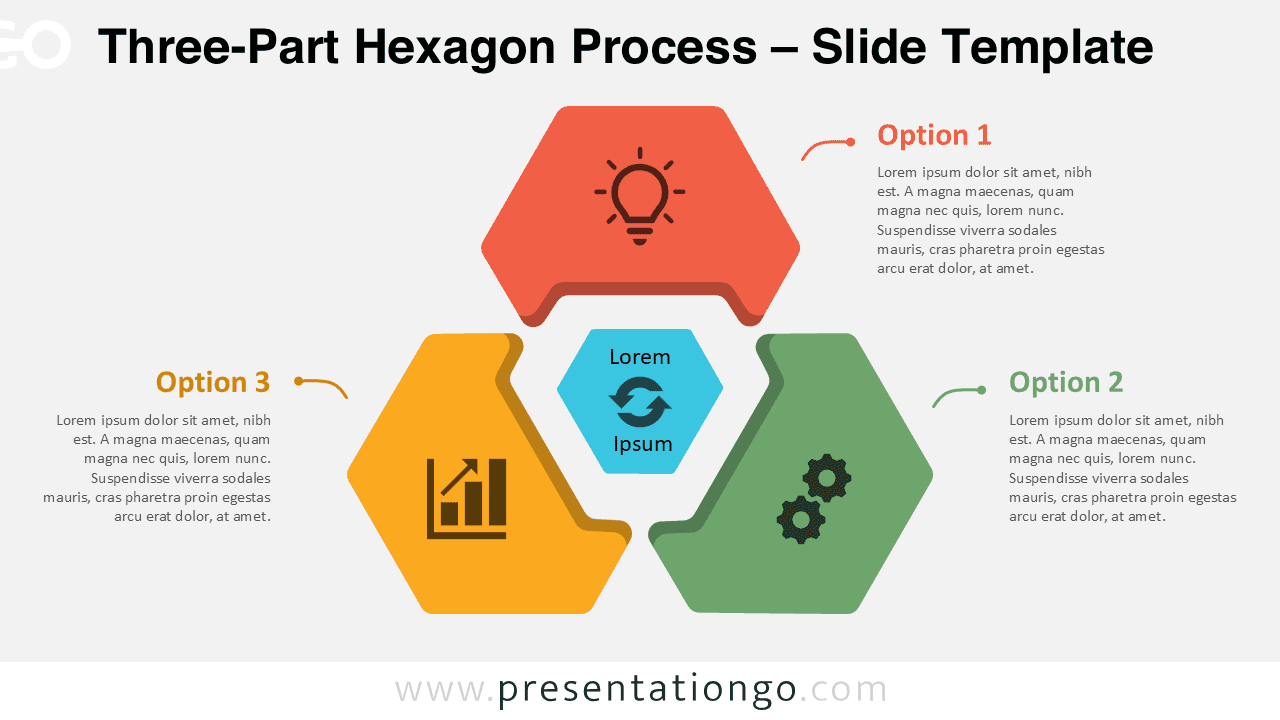
Three-Part Hexagon Process
A three-part hexagon process diagram for presenting workflows, strategies, options, or connected business steps.
Google Slides, PPTX
16:9
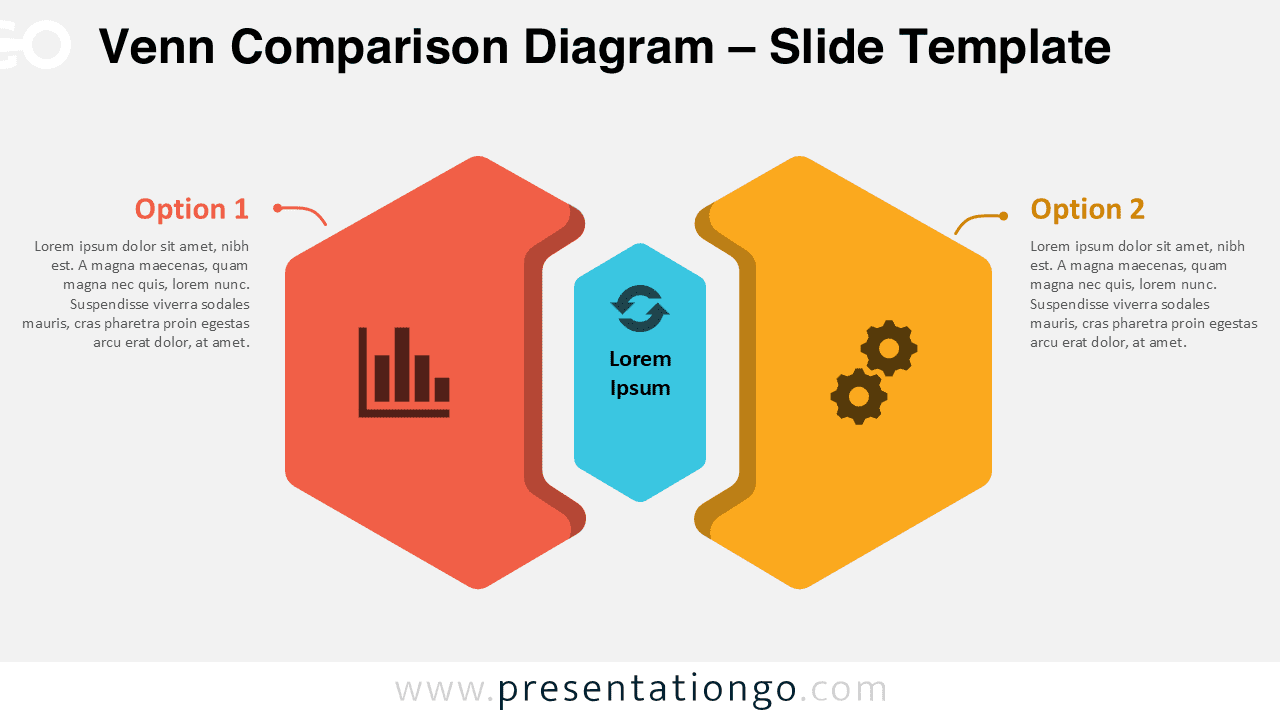
Venn Comparison Diagram
Compare two options with an editable Venn Comparison Diagram for PowerPoint and Google Slides.
Google Slides, PPTX
16:9
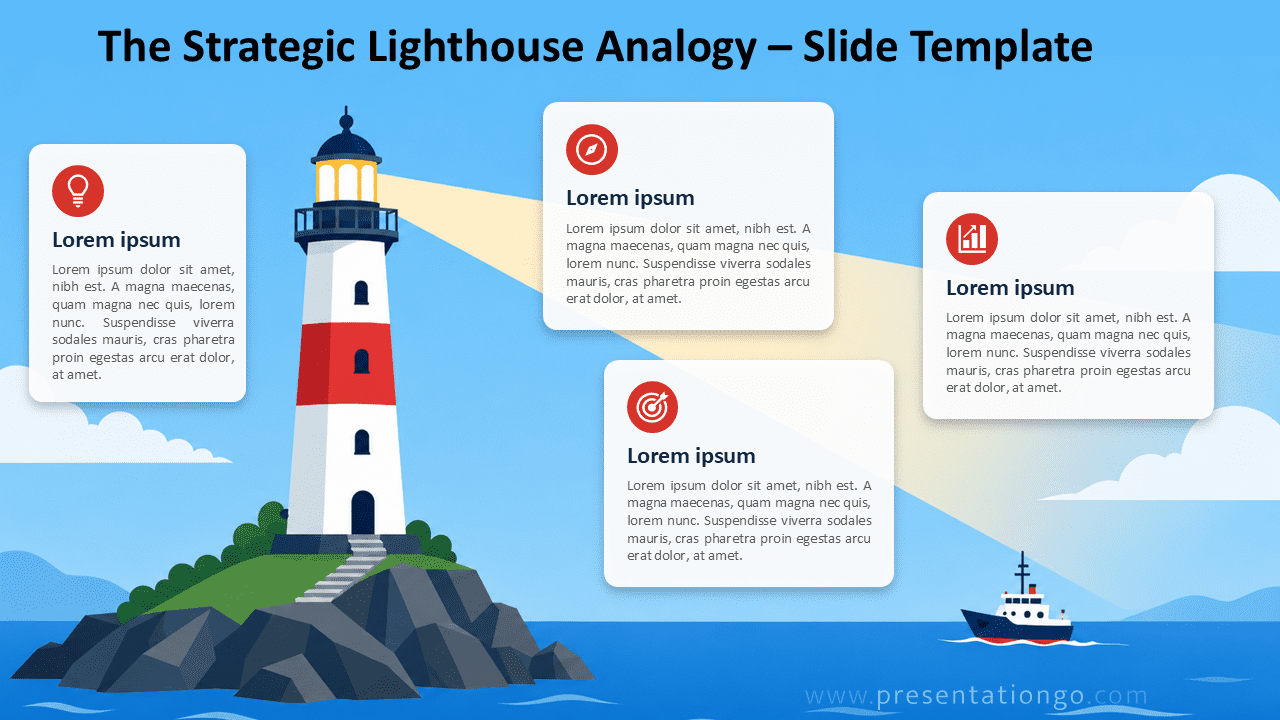
Strategic Lighthouse Analogy
Use this editable lighthouse analogy diagram to explain guidance, strategy, vision, and decision-making in PowerPoint or Google Slides.
Google Slides, PPTX
16:9
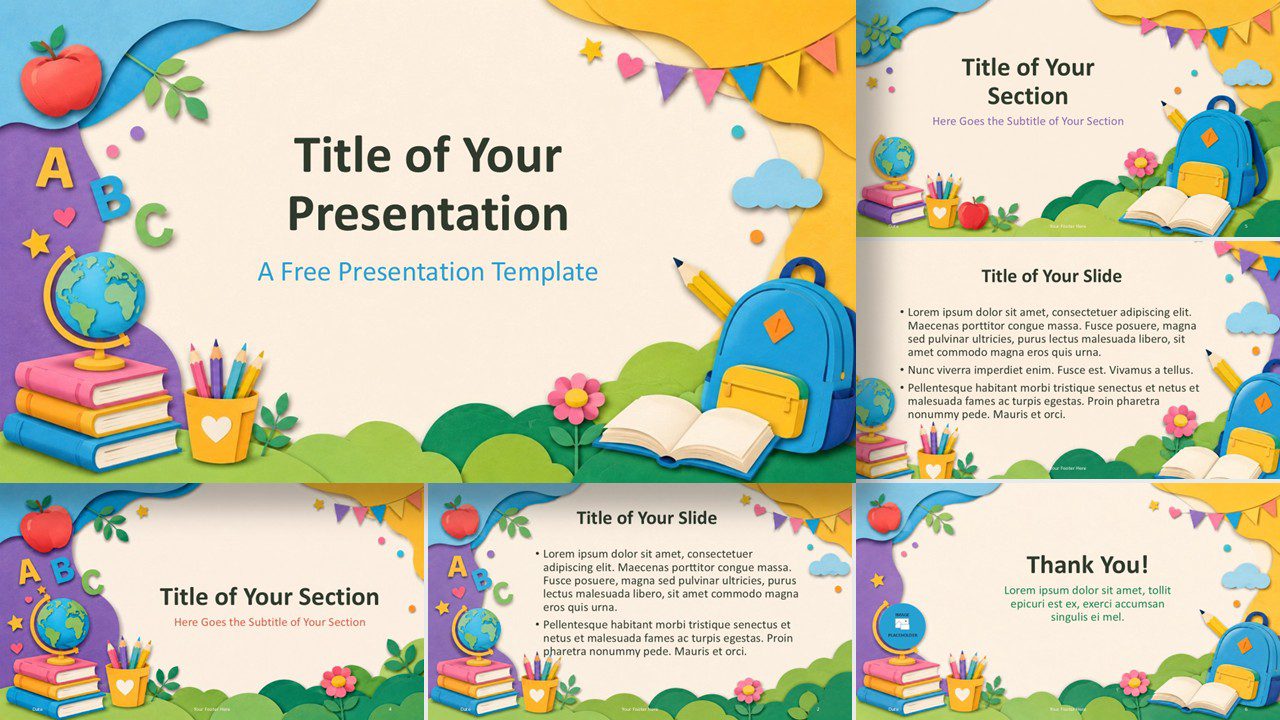
Playful Learning Template
Download a cheerful school template for PowerPoint and Google Slides with books, pencils, a globe, and soft paper-cut scenes for young learners and lessons.
Google Slides, POTX
16:9
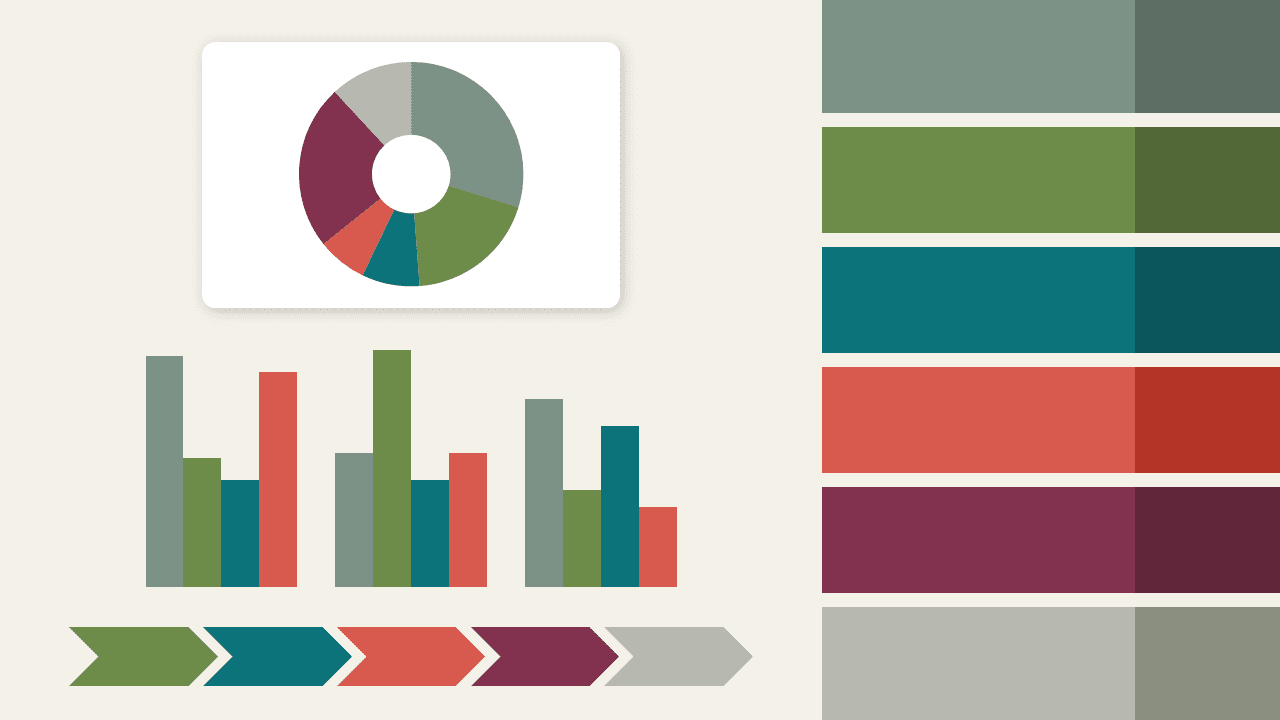
Nordic Botanica – Custom Color Palette
Download Nordic Botanica, a refined PowerPoint color palette with botanical tones for elegant, calm, and professional presentation design.
XML File
Color Palette
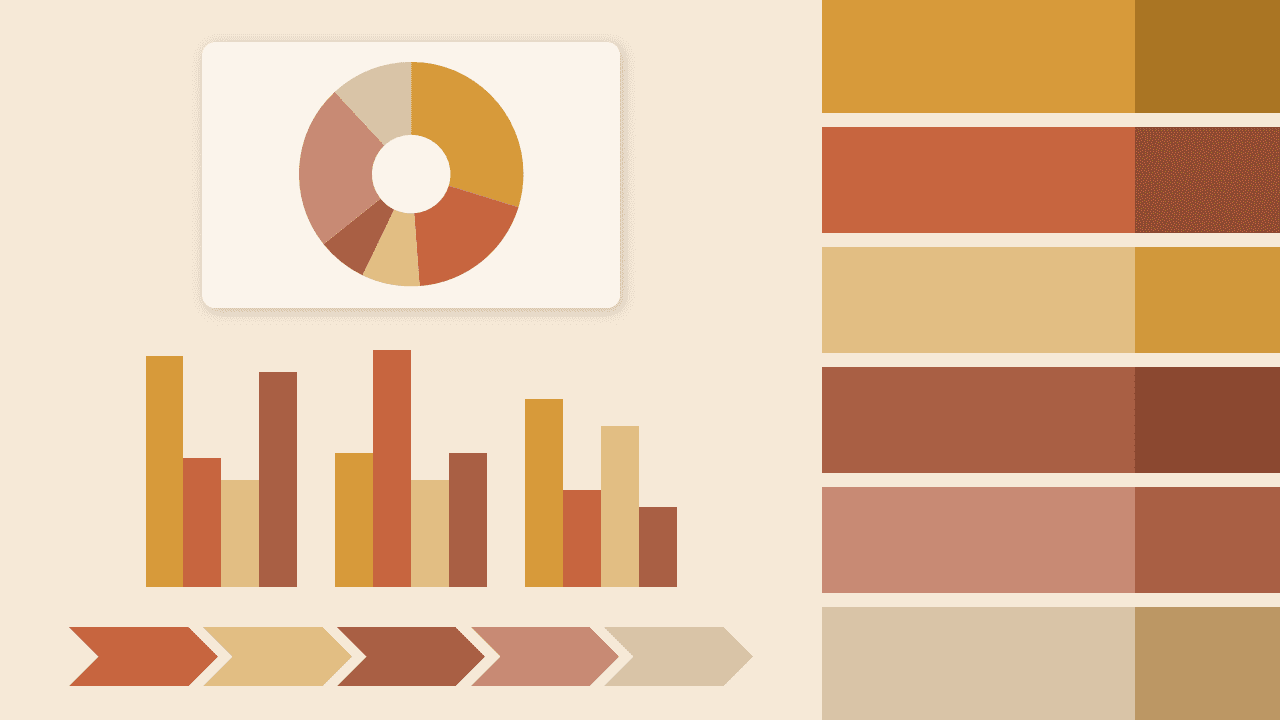
Spice Market – Custom Color Palette
Download Spice Market, a warm and refined PowerPoint color palette with earthy amber, terracotta, rose, wheat, and linen tones.
XML File
Color Palette
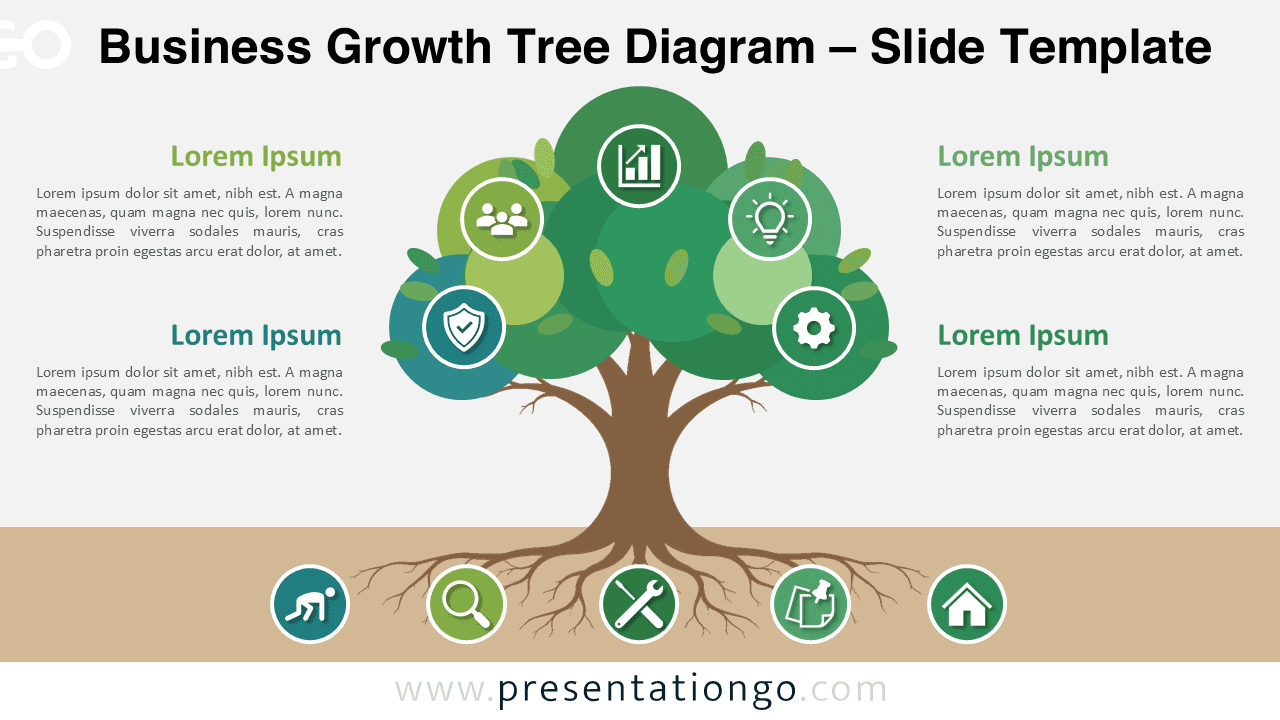
Business Growth Tree Diagram
Show business foundations and growth drivers with an editable tree diagram for PowerPoint and Google Slides.
Google Slides, PPTX
16:9
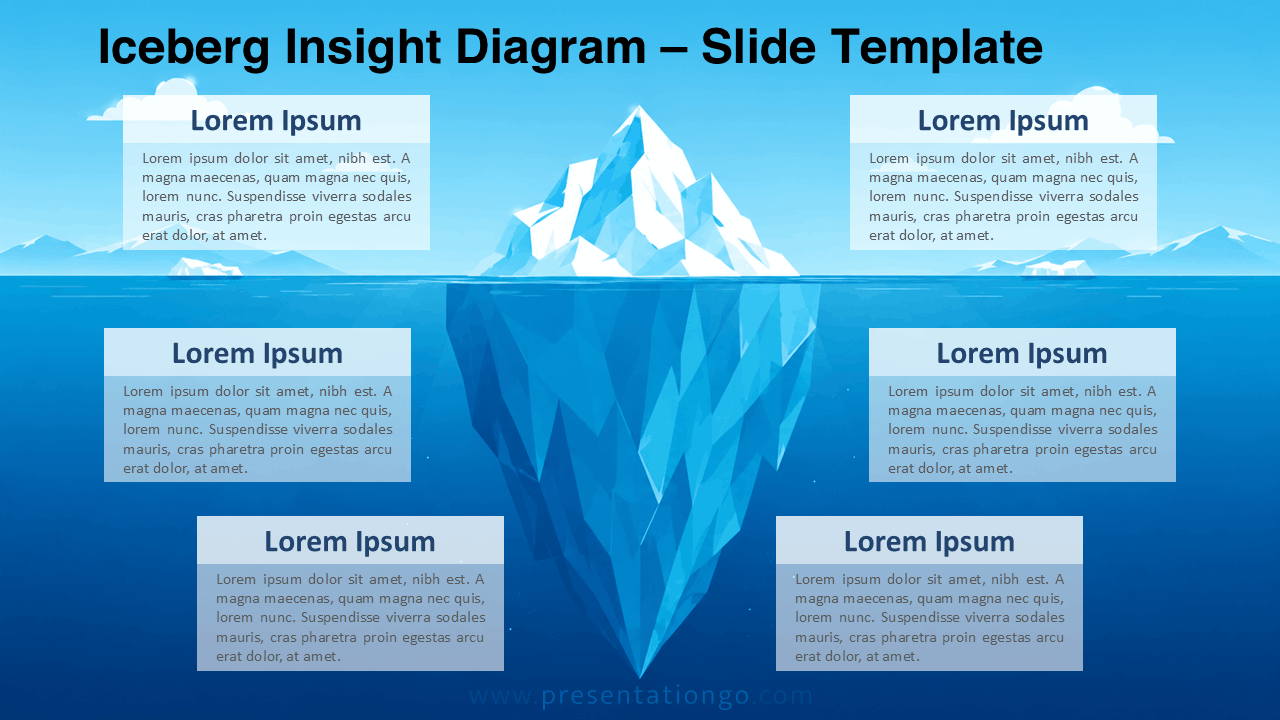
Iceberg Insight Diagram
Explain visible issues and hidden causes with this iceberg visual for PowerPoint and Google Slides.
Google Slides, PPTX
16:9
