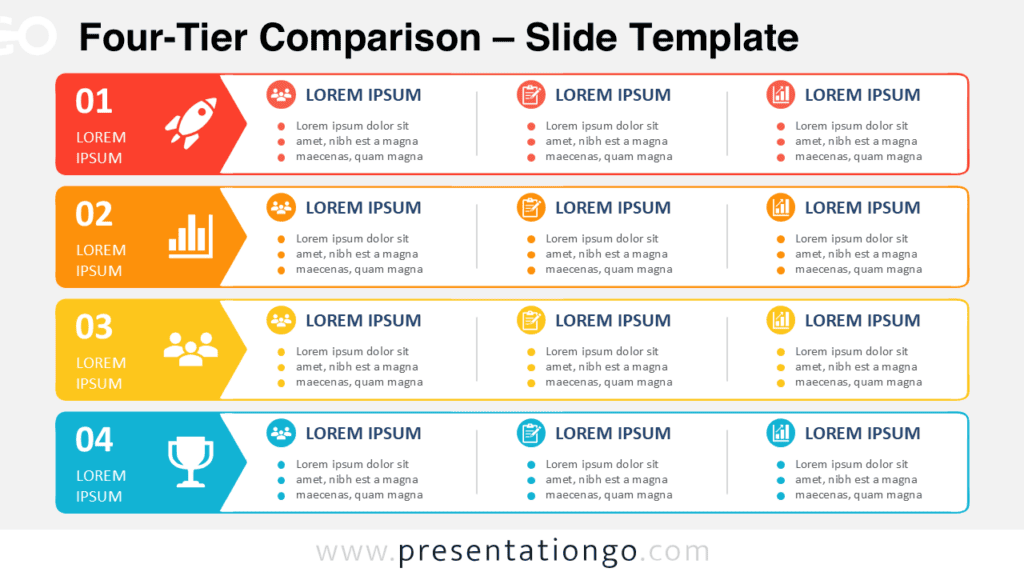
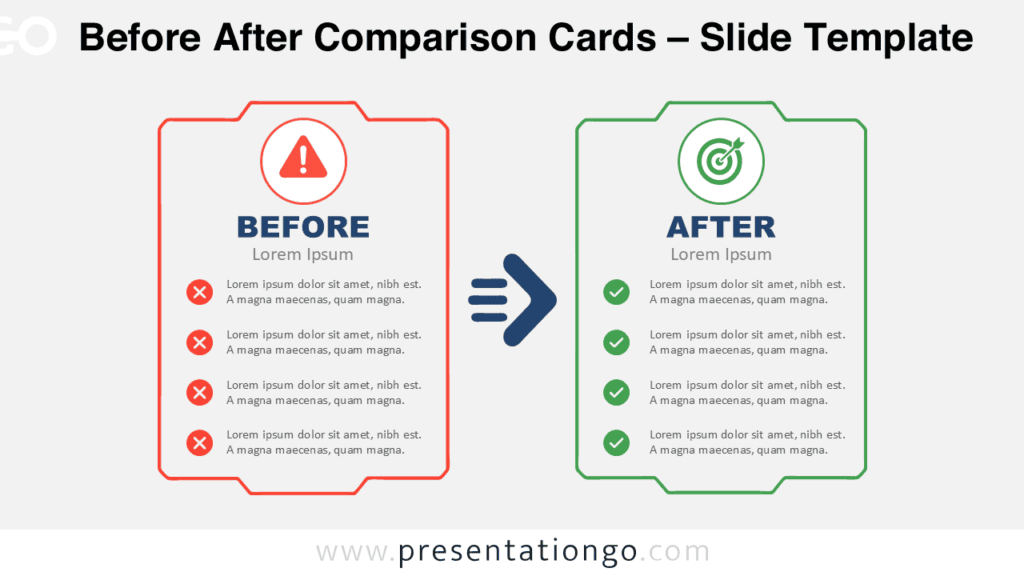
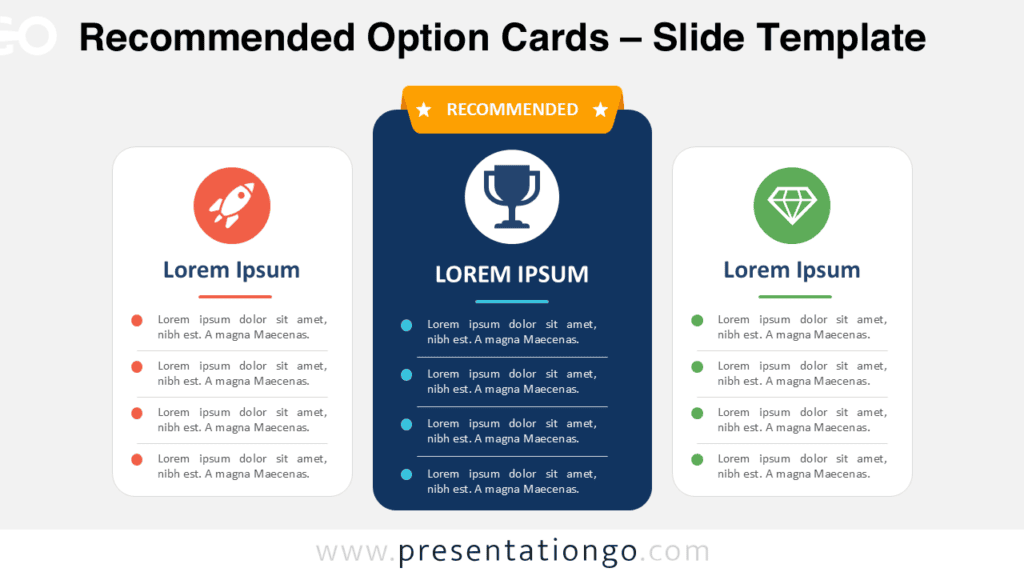
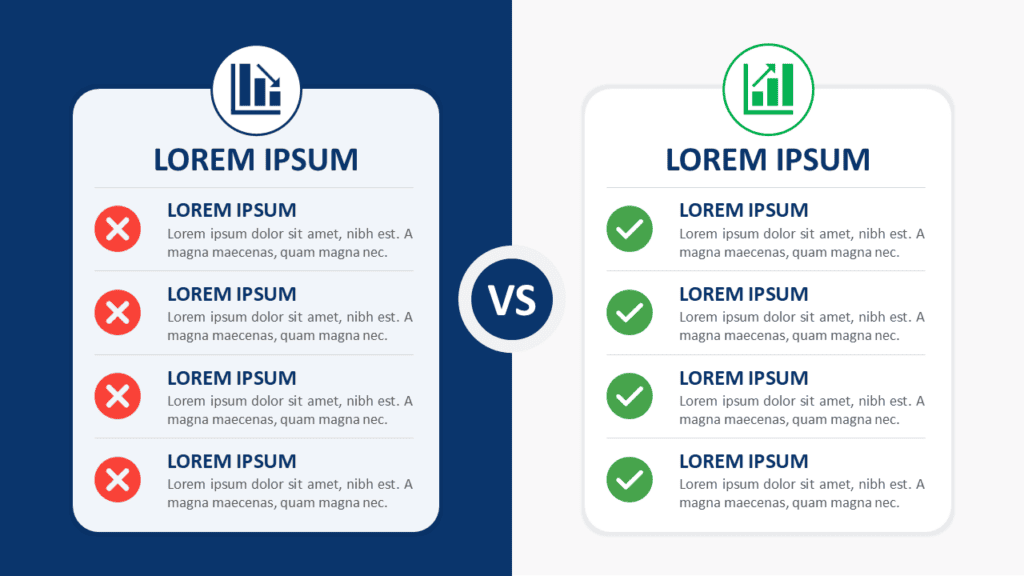
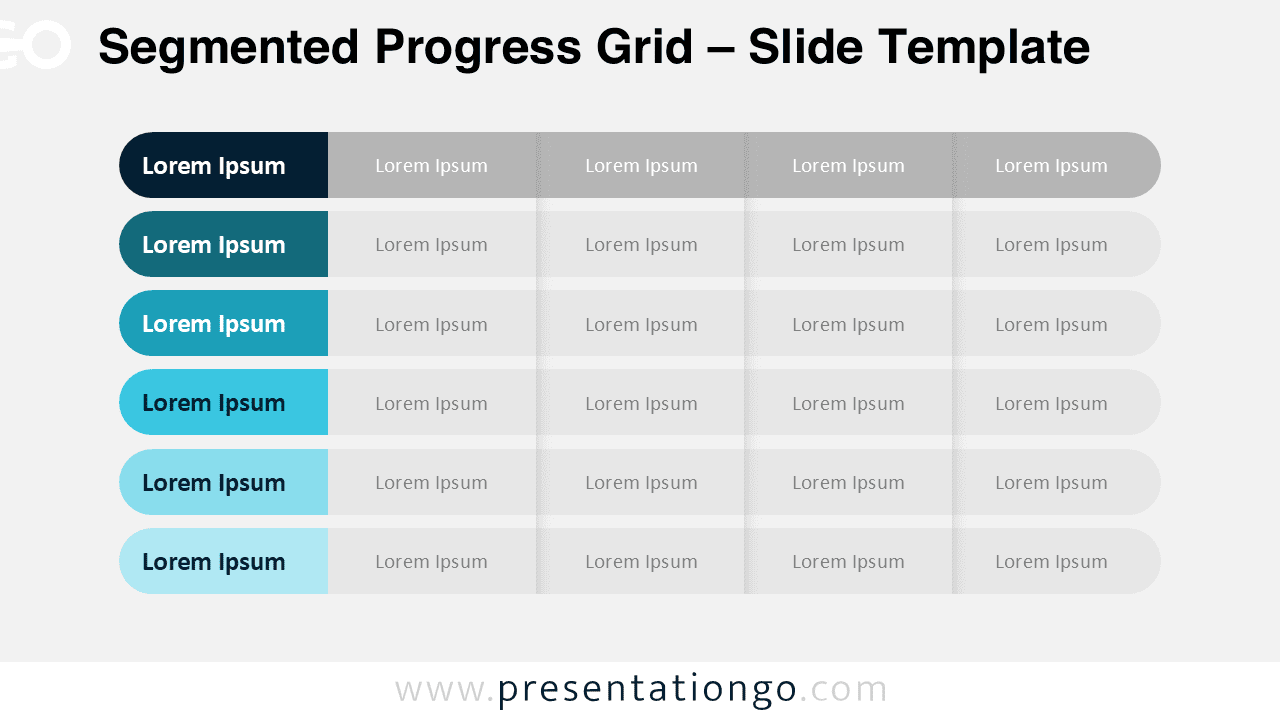
The Segmented Progress Grid is a clean and structured diagram designed for PowerPoint and Google Slides presentations. It helps you display comparisons, levels, or progress stages using clearly separated horizontal segments.
This layout replaces traditional tables with a more modern and visually engaging structure. Each row highlights a key category, while segmented extensions allow you to break down information into clear sub-sections.
Diagram Preview
Features and Customization Options
- Fully editable shapes and text elements
- Rounded segmented row design
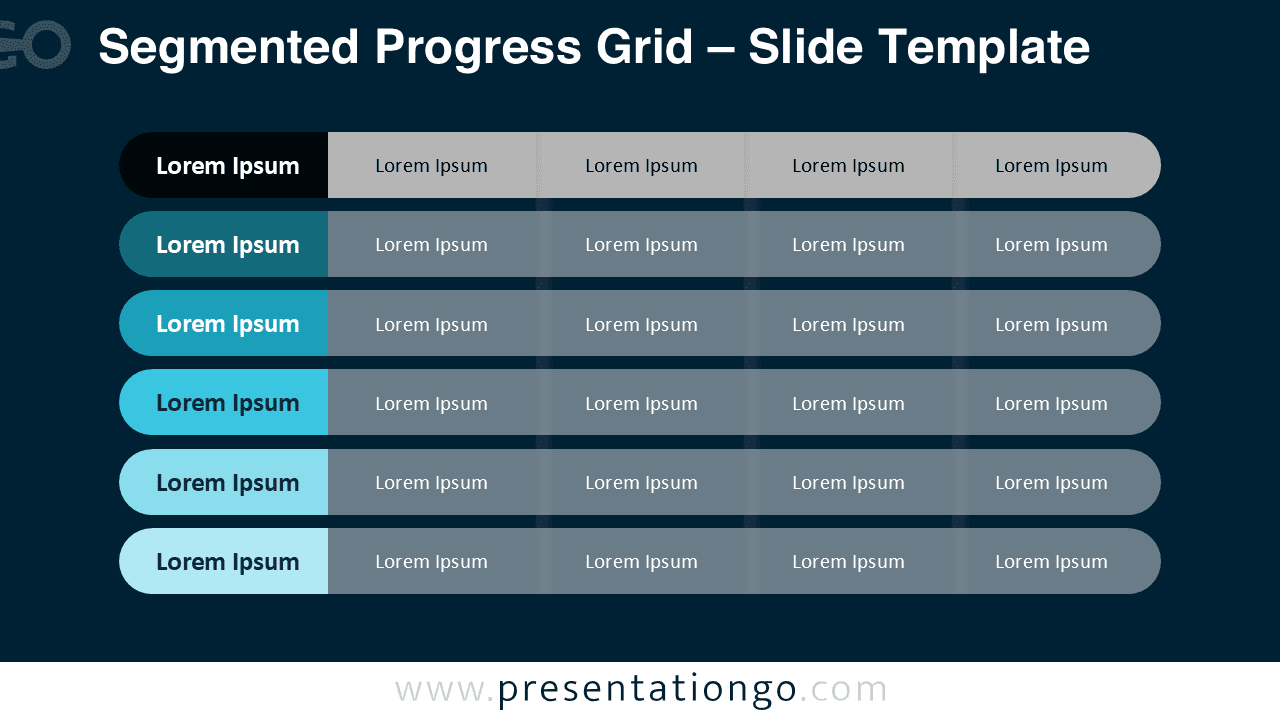
- Light and dark background versions included
- Easy color customization
- Works in both PowerPoint and Google Slides
- Clean alignment for professional presentations
Design and Structure
The Segmented Progress Grid uses six horizontal rows to structure information clearly. Each row begins with a highlighted rounded block, followed by extended segments that represent categories, metrics, or phases.
The consistent spacing and alignment ensure clarity. The progressive color variation from deep navy to light teal creates visual hierarchy without overwhelming the slide. This makes it suitable for executive dashboards, KPI summaries, or performance tracking.
Because the design avoids heavy data visuals, it works well for qualitative comparisons. You can easily duplicate or remove segments depending on your needs.
Practical Applications
- Service tier comparisons
- Project progress tracking
- Capability maturity levels
- Strategic initiative mapping
- Department performance overview
- Feature comparison slides
Summary
The Segmented Progress Grid offers a professional alternative to traditional tables. Its rounded segmented layout improves readability while keeping your presentation visually refined.
Use it to present structured comparisons, highlight levels, or display organized insights in both PowerPoint and Google Slides. The clean design ensures your message remains the focal point.