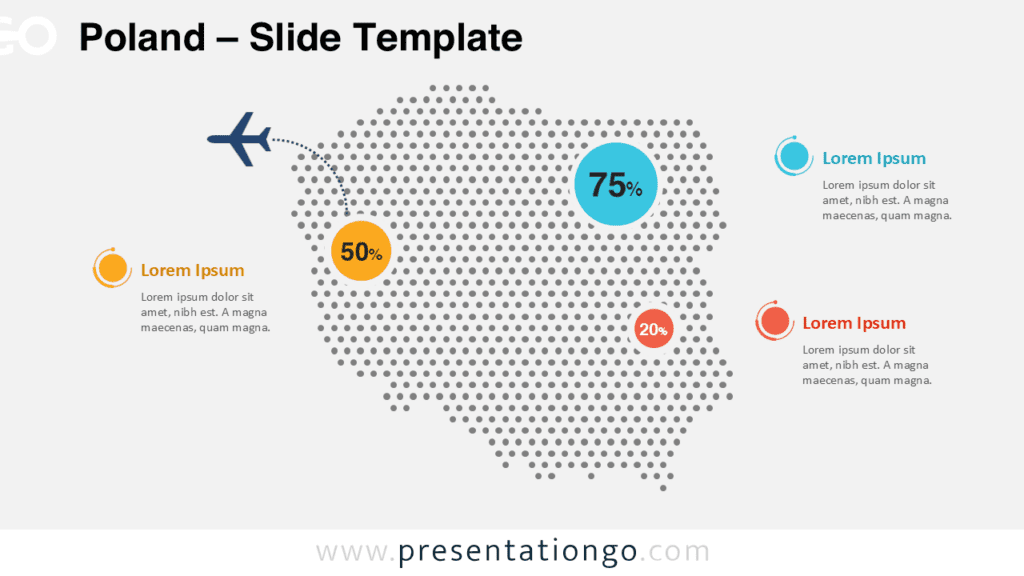
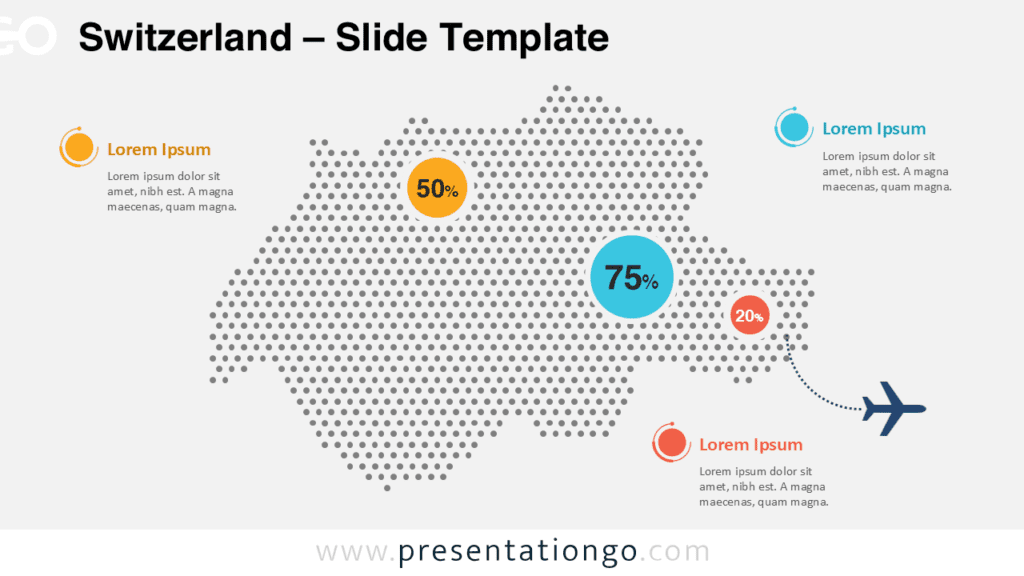
The Turkey Dotted Map Infographic provides a clean and modern way to present geographic information in your presentations. Designed for PowerPoint and Google Slides, this slide helps you visualize regional data, statistics, and market insights using a minimalist dotted map style.
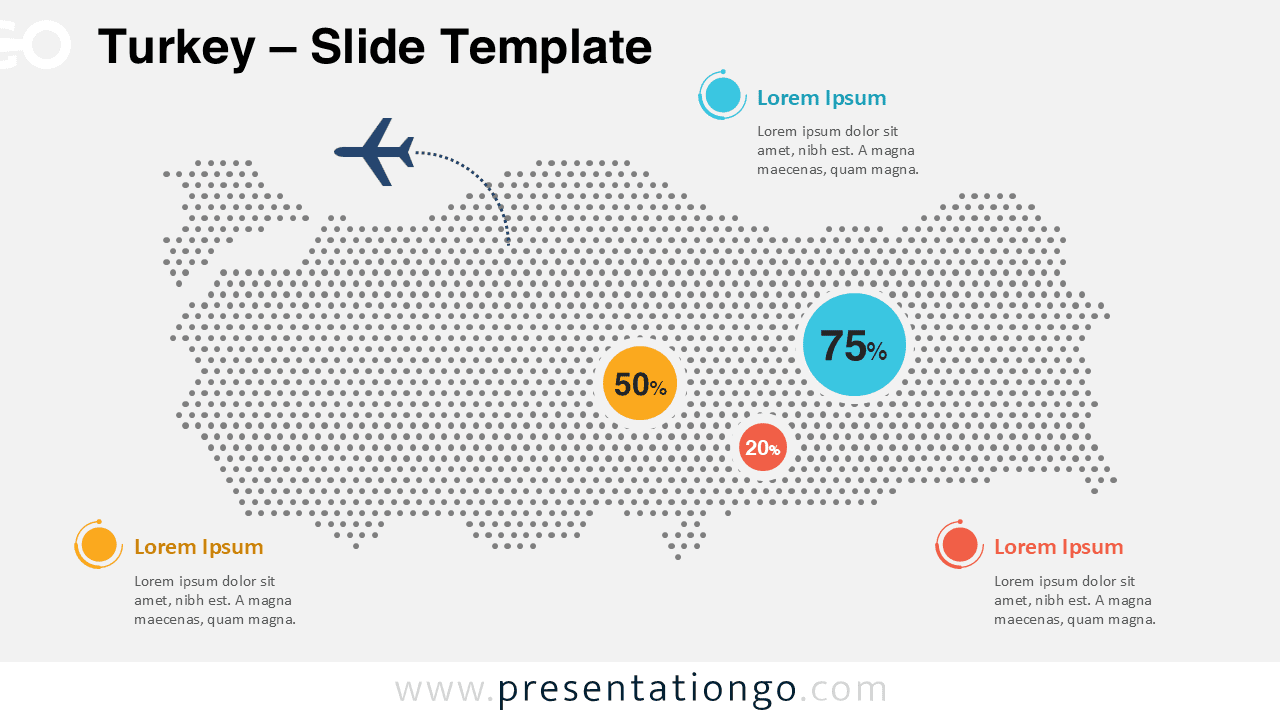
The map of Turkey is built from evenly spaced dots that create a clear and visually engaging geographic silhouette. This design approach keeps the slide lightweight while maintaining strong visual clarity. It works perfectly when presenting analytics, travel routes, or regional performance metrics.
Map Preview
Features and Customization Options
- Editable dotted map of Turkey
- Compatible with PowerPoint and Google Slides
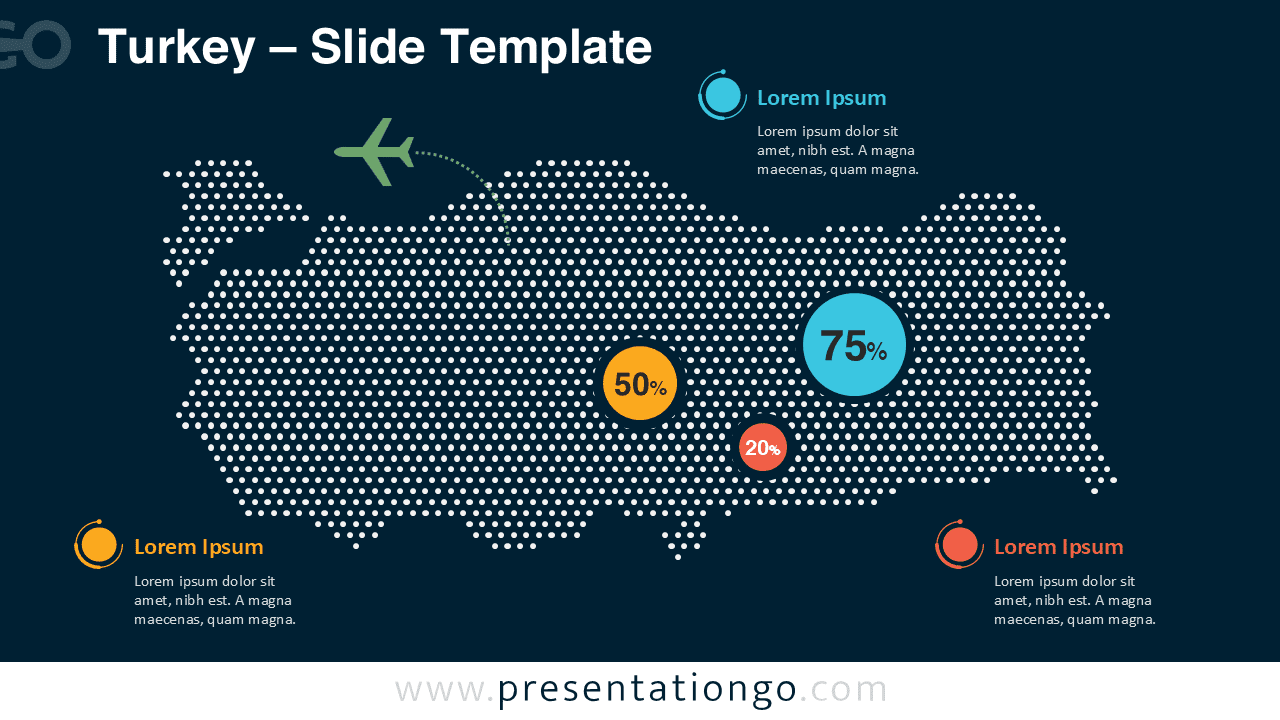
- Includes light and dark background versions
- Customizable markers for highlighting locations
- Editable colors, shapes, and data indicators
- Perfect for geographic storytelling and analytics
Design and Structure
The slide features a wide dotted map of Turkey placed at the center of the layout. The dots form a geometric pattern that keeps the map visually clean while preserving recognizable geography. Colored circular markers highlight important data points across the country, making it easy to present percentages, metrics, or locations.
Supporting text sections allow you to explain each highlighted point with concise descriptions. The design includes circular graphic accents and optional icons that help create visual balance across the slide. Two background versions are included so the infographic fits both light and dark presentation themes.
Practical Applications
- Market analysis across Turkey regions
- Business expansion presentations
- Tourism and travel route visualization
- Regional performance dashboards
- Population or demographic data presentations
- Logistics and transportation mapping
Summary
The Turkey Dotted Map Infographic helps presenters communicate geographic information in a clear and professional way. Its modern dotted design, editable elements, and dual background versions make it suitable for many types of business, education, and data-driven presentations.