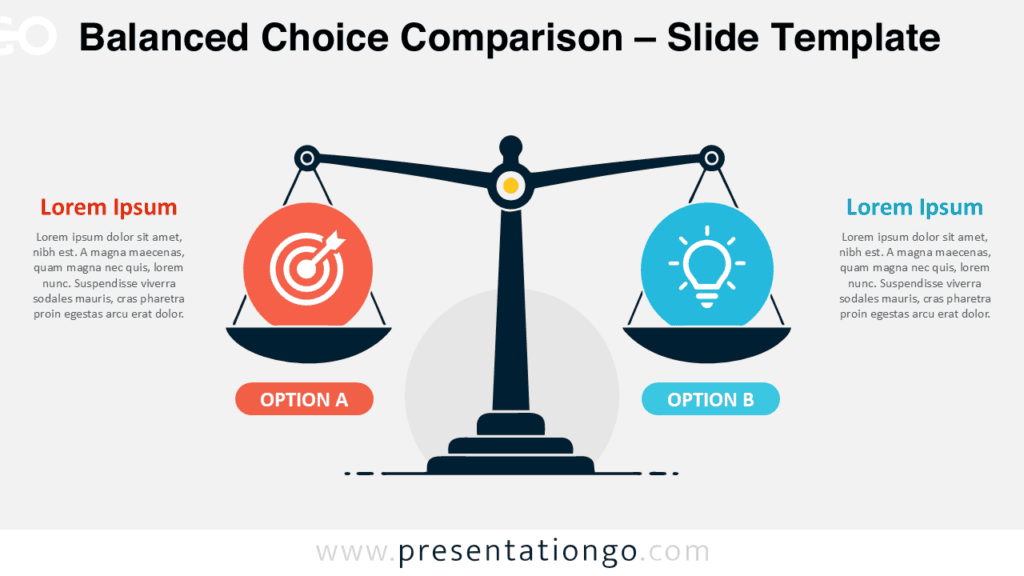
The Unbalanced Comparison Scale helps you show two alternatives that do not carry equal weight. Its tilted scale creates an immediate visual contrast between both sides. This makes the diagram useful when one option, priority, outcome, or argument outweighs another. You can use it in PowerPoint and Google Slides for business, strategy, education, and decision-making presentations.
Diagram Preview
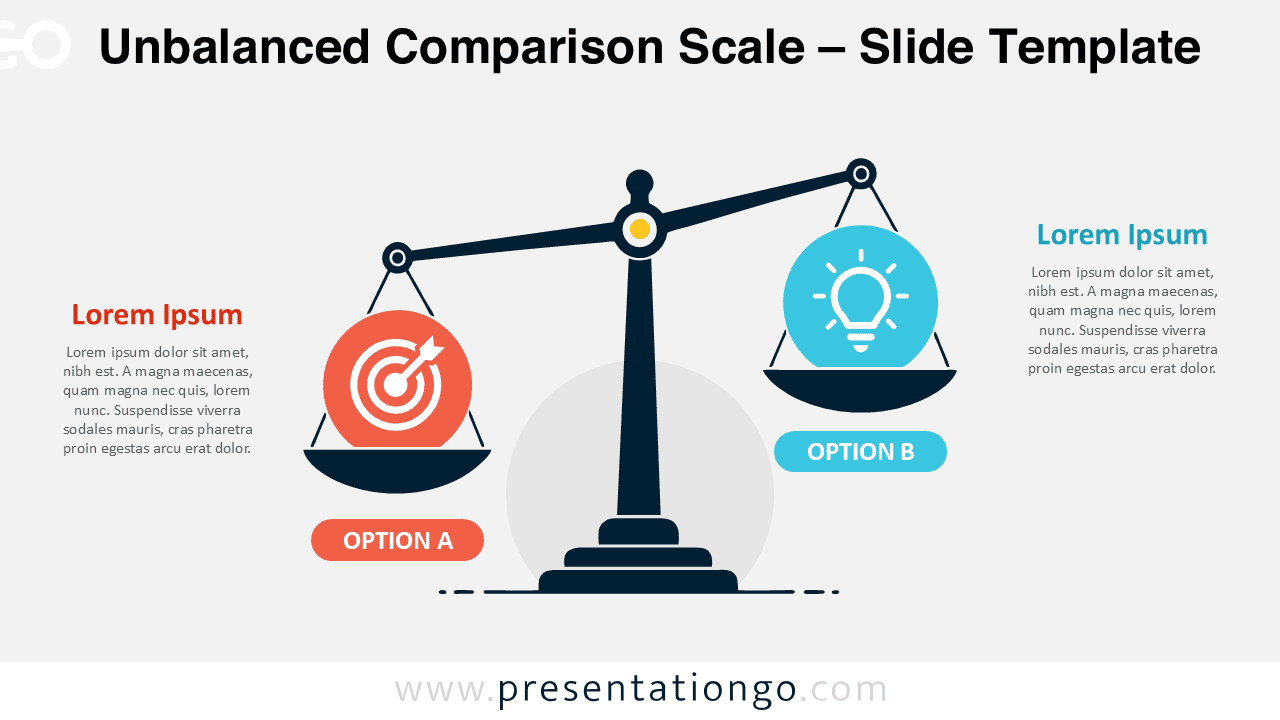
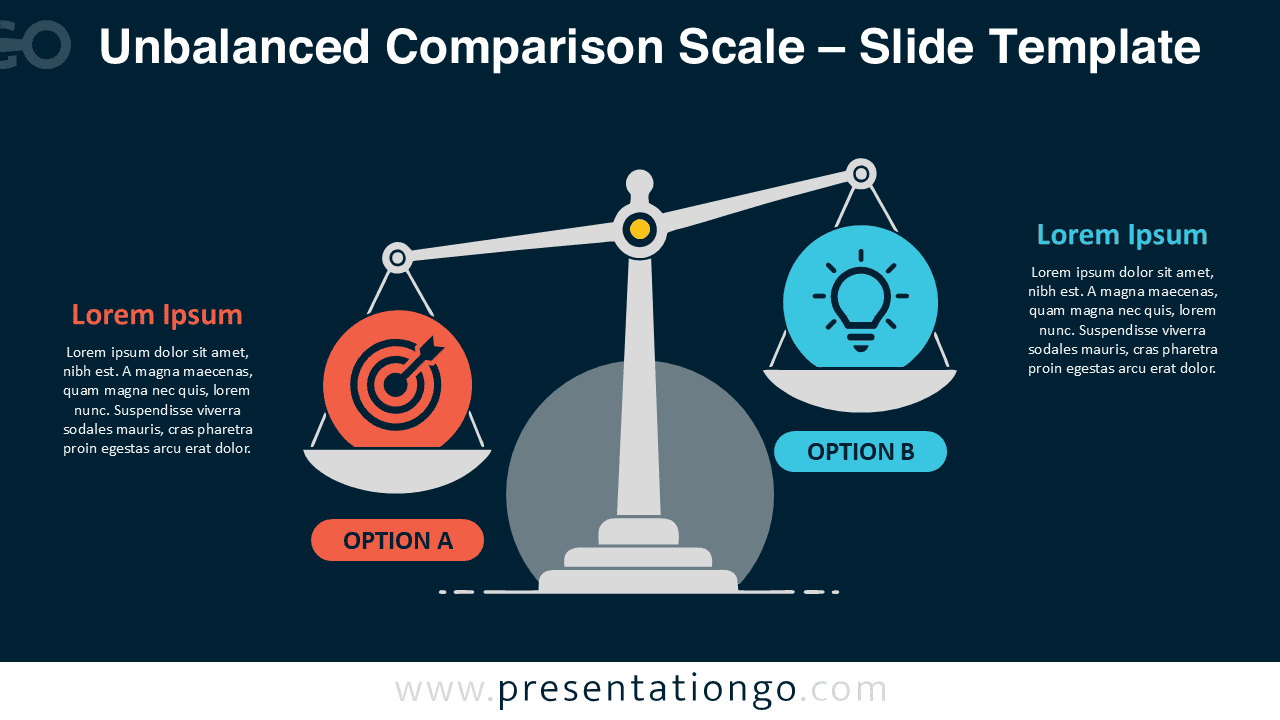
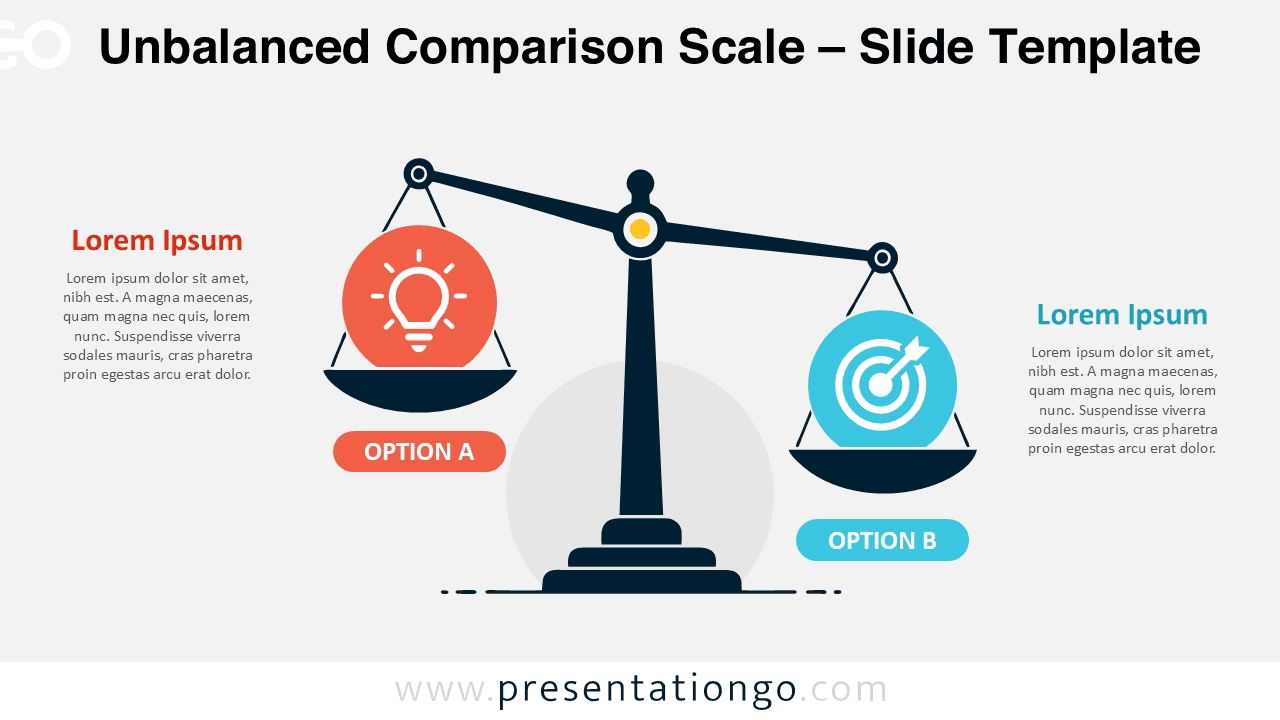
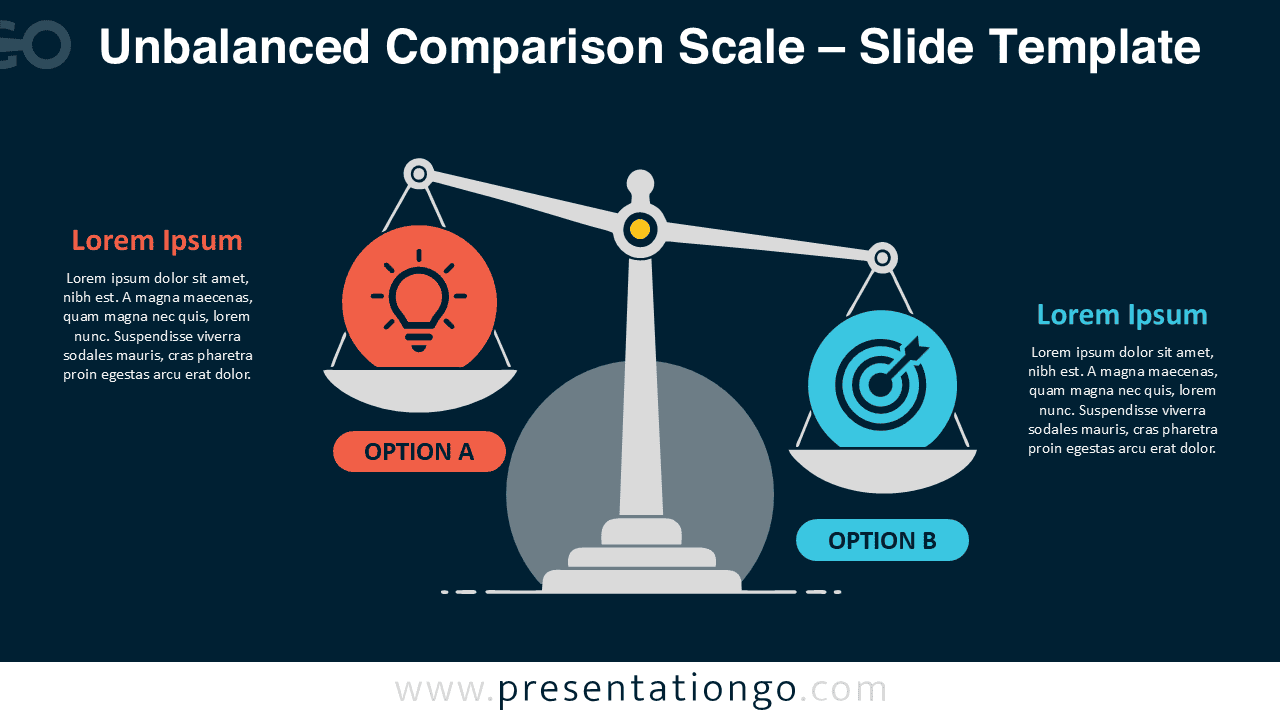
The design places a large scale at the center of the slide. Each side includes a circular graphic placeholder, a short label, and supporting text. The four-slide set provides two opposite scale positions. Each layout also comes in versions suited to different presentation themes. This flexibility lets you choose the direction that best supports your message.
Features and Customization Options
- 4 editable slide variations
- Two opposite scale positions
- Light and dark background options
- Editable text placeholders
- Customizable shapes and labels
- Icons from the Office icon library
- Icons are easily modifiable
- Replaceable icon placeholders
- Compatible with PowerPointand Google Slides
Unbalanced Comparison Scale Design and Structure
The central tilted scale gives the slide a strong visual hierarchy. Viewers can understand the relationship between both sides before reading the supporting text. This structure works especially well when you need to highlight unequal importance, influence, value, or impact.
Each side has enough space for a concise heading and explanation. The circular placeholders add visual emphasis without defining the subject of the comparison. You can replace the existing icons with other Office icons, images, or graphics that better match your topic. The layout stays clear even after you adapt the content.
The two directional variations also give you more control over the narrative. Place the stronger option on either side according to your presentation flow. This prevents the diagram from forcing a fixed interpretation and makes it easier to reuse.
Practical Applications
- Compare two strategic alternatives
- Show unequal priorities
- Present pros and cons
- Evaluate competing proposals
- Illustrate risk versus reward
- Compare costs and benefits
- Show weighted decision criteria
- Present resource allocation choices
- Explain opposing viewpoints
- Highlight stronger and weaker options
Summary
The Unbalanced Comparison Scale offers a simple way to communicate unequal choices and competing priorities. Its tilted structure turns an abstract comparison into a clear visual message. You can edit the text, shapes, labels, and illustrative placeholders to suit almost any topic. With four flexible layouts for PowerPoint and Google Slides, the diagram works well for presentations that need a direct two-sided comparison.