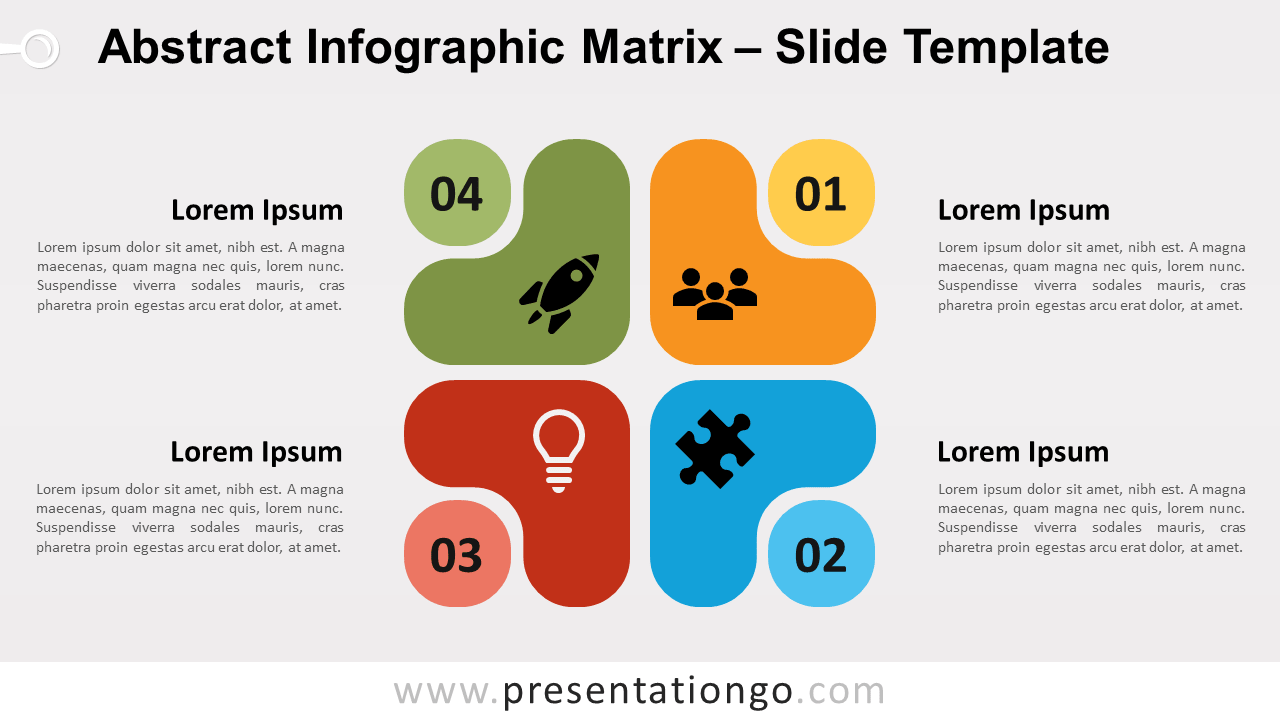
Free abstract infographic matrix for PowerPoint and Google Slides. Matrix diagram with four (4) rounded L-shapes. Editable graphics with numbers, icons, and text placeholders.
Matrix diagram with 4 rounded L-shapes
This X-shaped matrix diagram is useful for comparing two pairs of complementary elements. The diagram with an X- and Y-axis forming a cross or “X” shape that compares four total groups of data. In this relationship matrix, each axis is related to the groups immediately adjacent to it, but not the group across from it.
Use this X-shaped diagram to compare 4 groups of items.
The 2×2 matrix is commonly used in business strategy as a representational tool to show conflicting concepts and for decision making. This four-quadrant matrix diagram is perfect to be used for business or marketing matrices like BCG, SWOT, Ansoff, risk assessment…
Use this matrix for a SWOT diagram – EXAMPLE:
See below how this template can be adapted for any purpose – for e.g., the SWOT analysis:

Shapes are 100% editable: colors and sizes can be easily changed.
Includes 2 slide option designs: Standard (4:3) and Widescreen (16:9).
Widescreen (16:9) size preview:


This ‘Abstract Infographic Matrix for PowerPoint and Google Slides’ features:
- 2 unique slides
- Light and Dark layout
- Ready to use template with numbers, icons, and text placeholders
- Completely editable shapes
- Uses a selection of editable PowerPoint icons
- Standard (4:3) and Widescreen (16:9) aspect ratios
- PPTX file and for Google Slides
Free fonts used:
- Helvetica (System Font)
- Calibri (System Font)


Comments are closed.