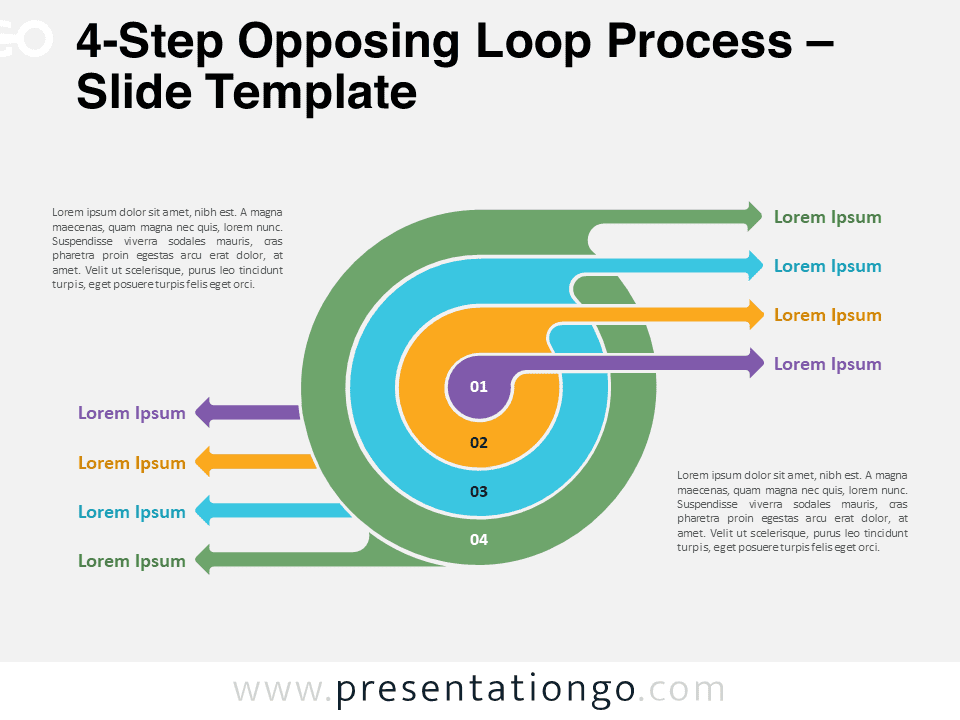
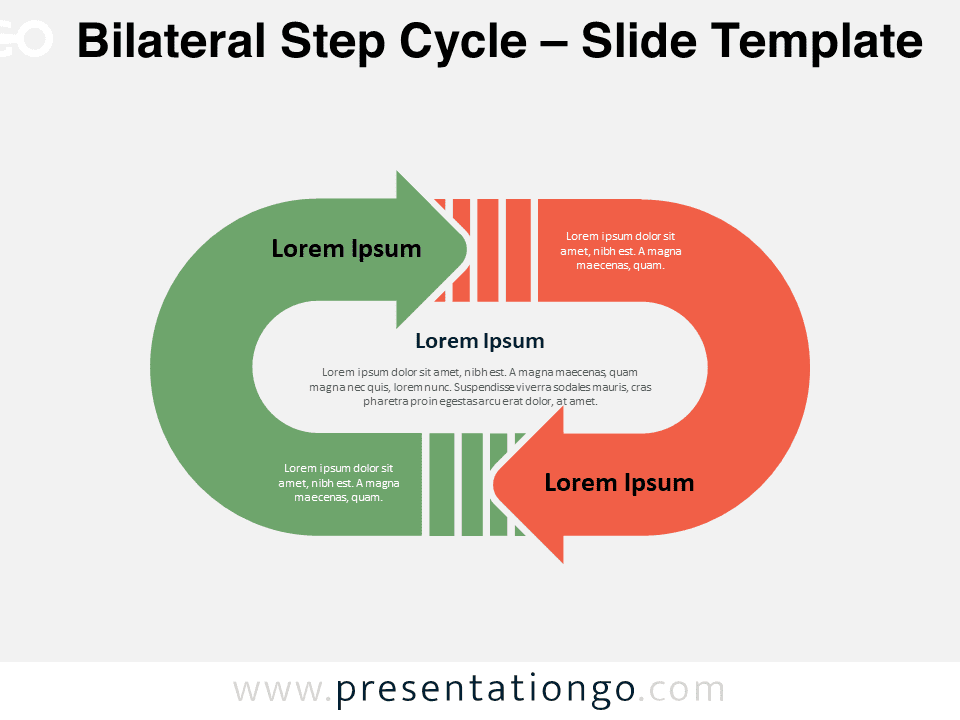
Free bipolar cycle infographics for PowerPoint and Google Slides. A stylish cycle graphic to showcase 2 ideas. Editable graphics with icons and text placeholders.
Bipolar Cycle Infographics
There are always two sides to a story, a beginning, and an end. At the same time, cycles go round and round. This great chart combines two main elements to express complex ideas and flows in a simple visual way. Show your audience you know a trick or two thanks to this free Bipolar Cycle Infographics template!
This slide displays a central circle with two shades of blue and two arrowheads. Indeed, two up and down curved arrows form a 2-part circular shape, like a cycle. These are here to represent movement and flow. Besides, you can write a title inside the circle. You will also find two stylish curved gray lines symbolizing your 2 options, ideas, facts or stats. They lead to a specific place where you can insert an icon and a title. Finally, there are 2 extra text placeholders if you need to explain your ideas further.
This free Bipolar Cycle Infographics template is a great tool to show the influence of two elements in a circular process, or two consequences that come out of this circle.
Shapes are 100% editable: colors and sizes can be easily changed.
Includes 2 slide option designs: Standard (4:3) and Widescreen (16:9).
Widescreen (16:9) size preview:
This ‘Bipolar Cycle Infographics’ template features:
- 2 unique slides
- Light and Dark layout
- Ready to use template with icons and text placeholders
- Completely editable shapes
- Uses a selection of editable PowerPoint icons
- Standard (4:3) and Widescreen (16:9) aspect ratios
- PPTX file (PowerPoint) and for Google Slides
Free fonts used:
- Helvetica (System Font)
- Calibri (System Font)


