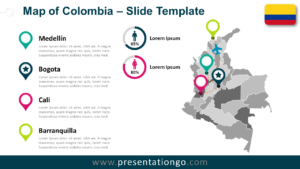
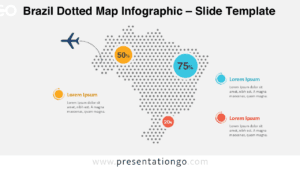
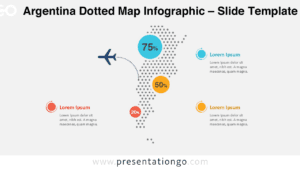
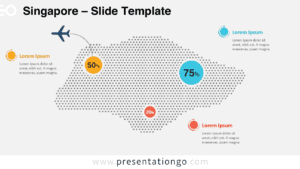
The Colombia Dotted Map Infographic offers a clean and modern way to visualize geographic information in PowerPoint and Google Slides presentations. This infographic features a dotted representation of Colombia, allowing presenters to highlight locations, statistics, and regional insights with clarity and visual impact.
The design focuses on simplicity and readability. The map is built using evenly spaced dots that form the recognizable silhouette of Colombia. This approach provides a modern infographic style while keeping the map visually light and easy to integrate into professional presentations.
Map Preview
Features and Customization Options
- Editable dotted map of Colombia
- Two slide versions included for different presentation themes
- Light and dark background layouts
- Fully customizable shapes and colors
- Data markers to highlight statistics or key regions
- Text placeholders for descriptions and explanations
- Compatible with PowerPoint and Google Slides
- Clean and modern infographic design
Design and Structure
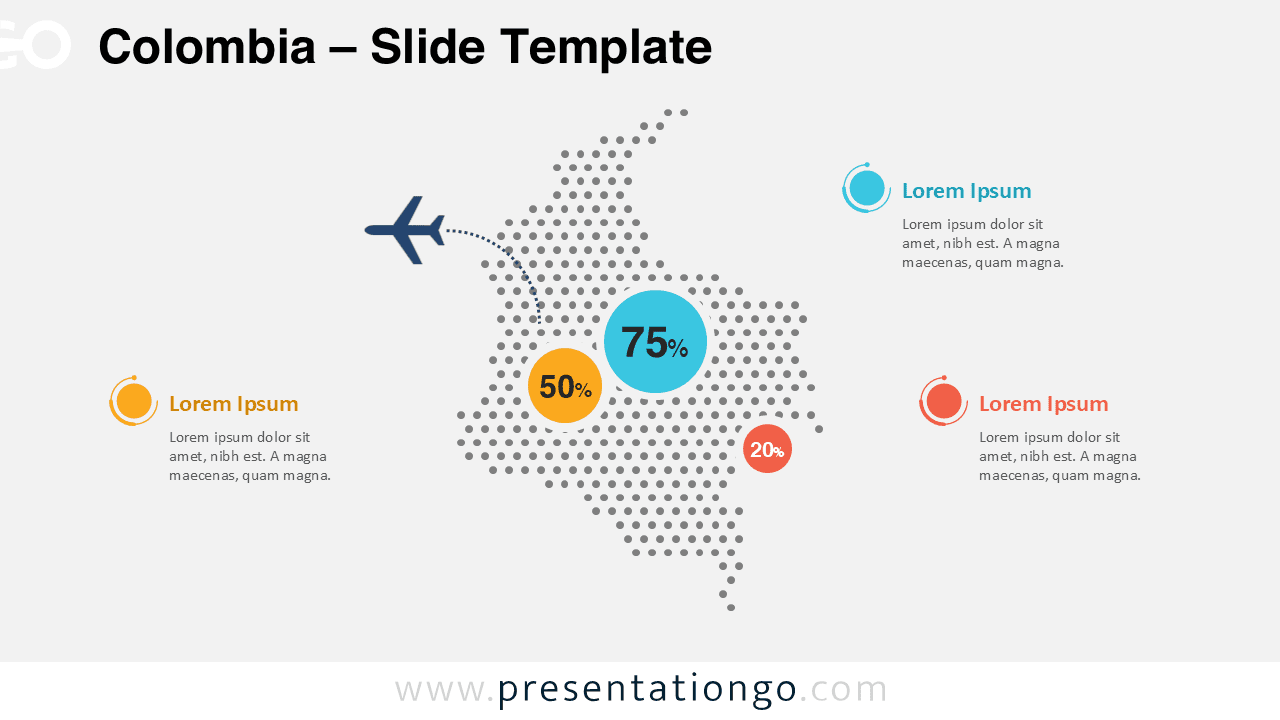
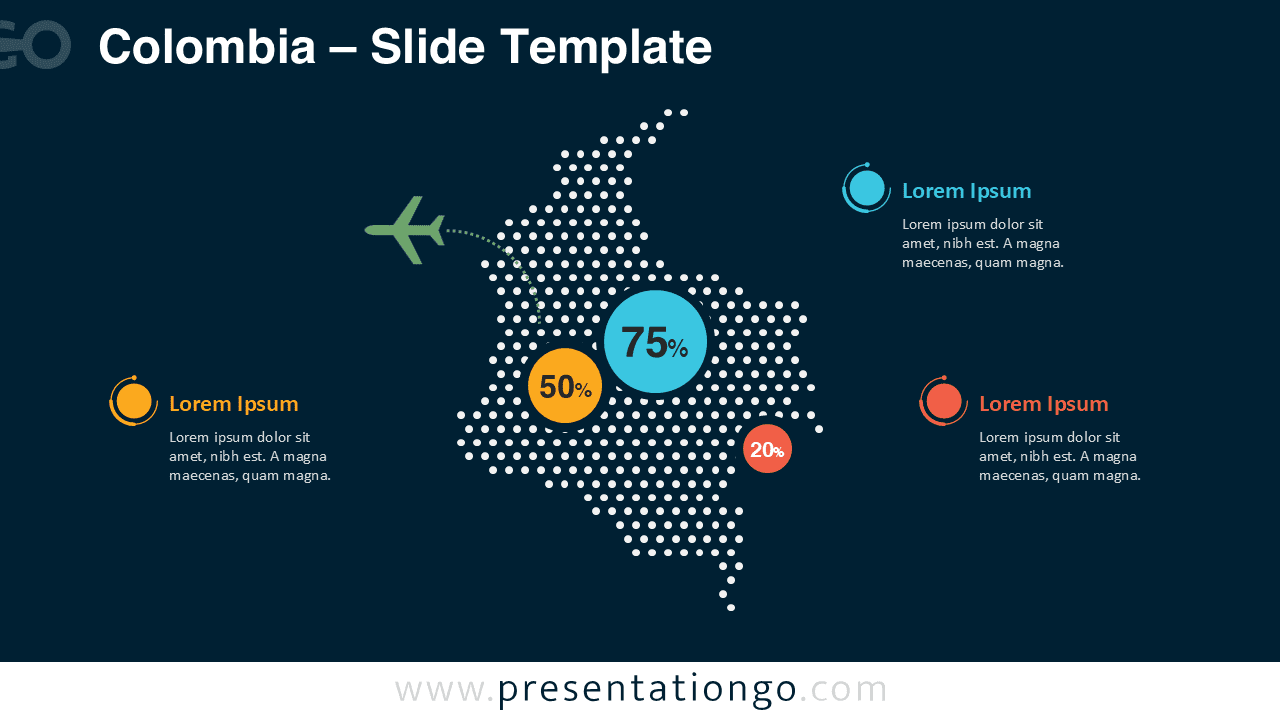
The infographic centers around a dotted map of Colombia designed with evenly spaced circular points. The dotted structure provides a contemporary visual style while maintaining geographic recognition. Highlight circles allow users to emphasize specific values such as percentages, statistics, or key performance indicators.
Supporting text areas appear on both sides of the map, making it easy to explain insights or provide contextual information. An additional graphic element, such as a travel route or directional arrow, can illustrate connections, logistics flows, or international relations.
The template includes two slide variations. One slide uses a bright background suitable for traditional presentations, while the second slide features a darker background designed for high-contrast displays and modern visual styles.
Practical Applications
- Present regional statistics about Colombia
- Visualize market expansion strategies
- Display tourism and travel insights
- Highlight logistics routes and distribution networks
- Explain demographic or economic data
- Support geographic storytelling in business presentations
- Illustrate research findings related to Colombian regions
Summary
The Colombia Dotted Map Infographic helps presenters communicate geographic data with clarity and visual impact. Its modern dotted design makes it ideal for business reports, tourism presentations, logistics overviews, or academic analysis.
With fully editable elements and compatibility with both PowerPoint and Google Slides, this infographic allows you to customize colors, data markers, and text to match your presentation style and communication goals.