Free hourglass charts for PowerPoint. 4 hourglass graphics with data-driven charts using 100% stacked column for the sand level. Editable graphics with text placeholder.
Hourglass Charts
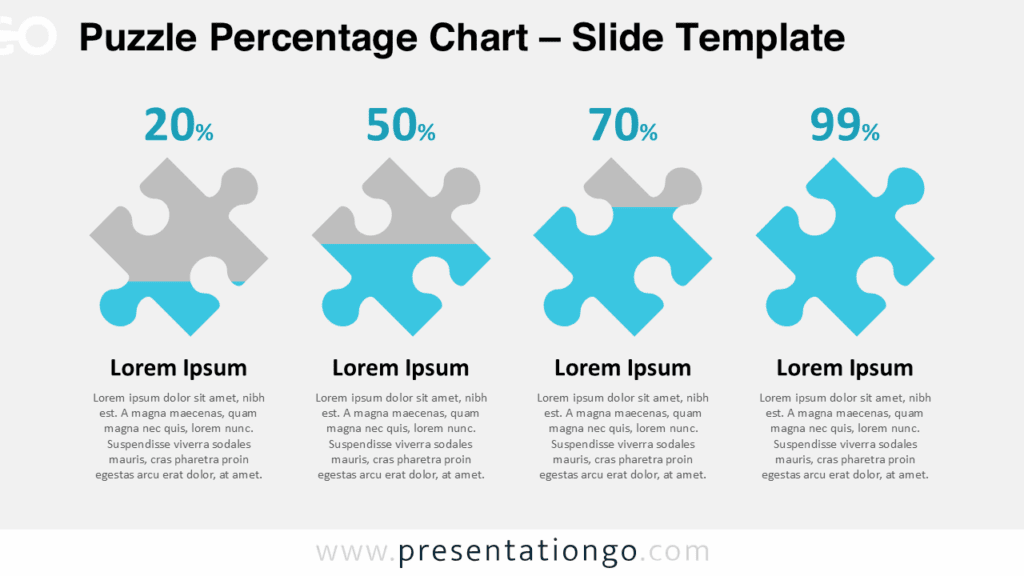
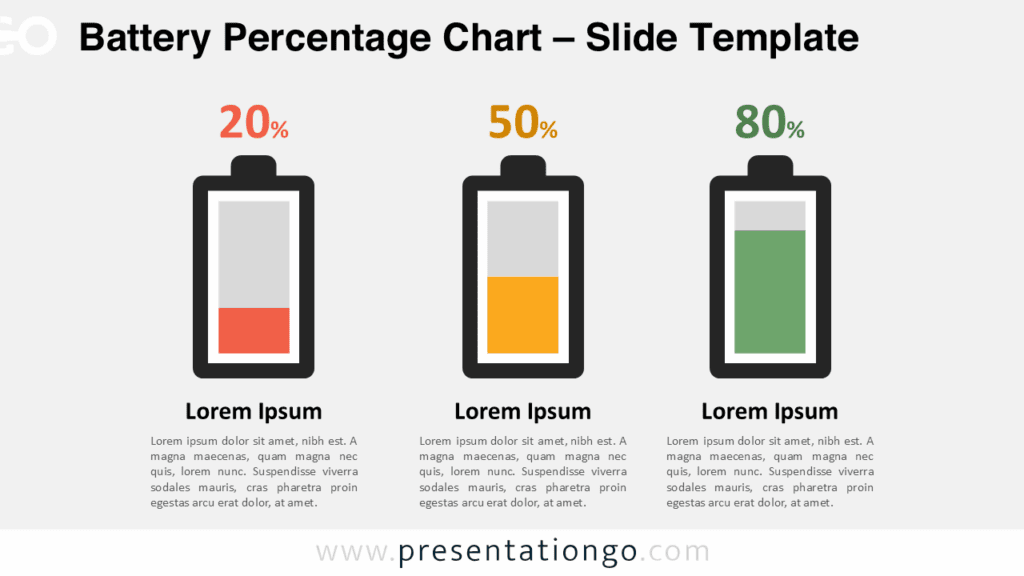
Great charts to compare quantitative results.
Shapes are 100% editable: colors and sizes can be easily changed.
Built-in data driven PowerPoint chart: you can easily change data series and format.
Includes 2 slide option designs: Standard (4:3) and Widescreen (16:9).
Usage instructions:
Click on the shape to change the background color – to fit yours. Then, just right-click the chart to edit the data series (Edit Data):

Widescreen (16:9) size preview:


This ‘Hourglass Charts for PowerPoint’ features:
- 2 unique slides
- Light and Dark layout
- Ready to use template with text placeholder
- Completely editable shapes
- Data-driven charts
- Standard (4:3) and Widescreen (16:9) aspect ratios
- PPTX file
Free fonts used:
- Helvetica (System Font)
- Calibri (System Font)


Comments are closed.