Free bottle chart for PowerPoint. Pictorial visualization of 3 plastic water bottle shapes filled with a 100% stacked column graph. Editable graphics with text placeholders.
Bottle Chart
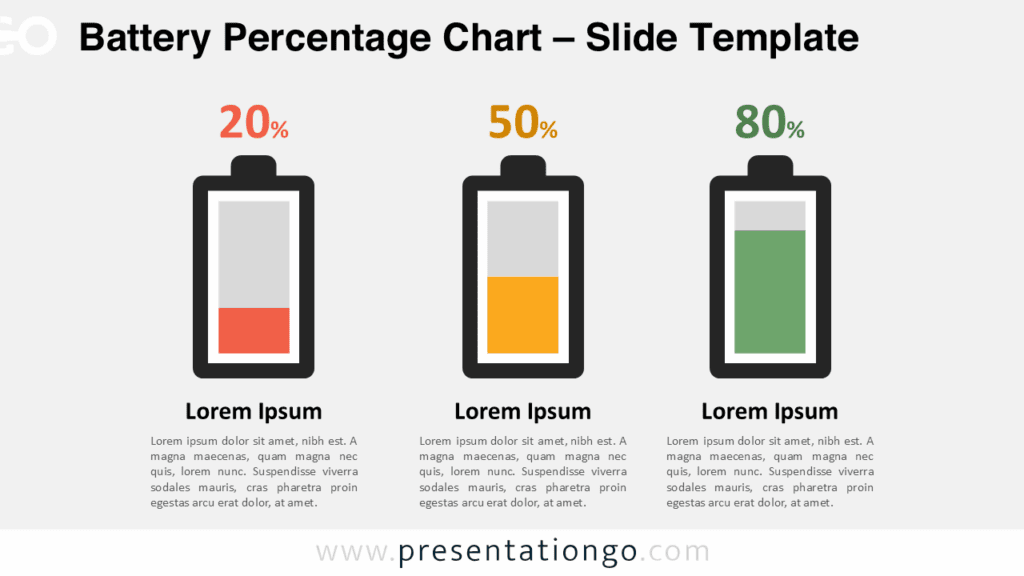
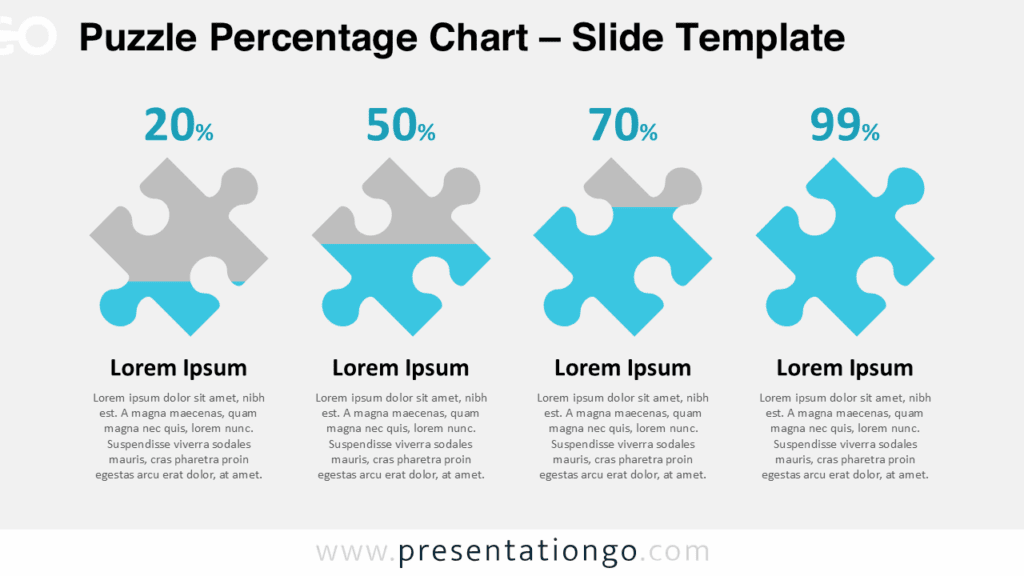
This creative data visualization template will make your data easier for your audience to understand.
Use this pictorial stacked percentage chart in your presentation to compare quantitative results or to illustrate data about food, beverage, or more specifically about water.
Shapes are 100% editable: colors and sizes can be easily changed.
Includes 2 slide option designs: Standard (4:3) and Widescreen (16:9).
Usage instructions:
Built-in data driven PowerPoint chart: made with 100% stacked column chart, you can easily change data series and format (e.g., colors).
First step – Select and customize the color of the bottle shape to fit your slide’s background
Second step – Just right-click the chart to edit the data series (Edit Data):

Widescreen (16:9) size preview:


This ‘Bottle Chart for PowerPoint’ features:
- 2 unique slides
- Light and Dark layout
- Ready to use template with text placeholders
- Completely editable shapes
- Data-driven (100% stacked column) charts
- Standard (4:3) and Widescreen (16:9) aspect ratios
- PPTX file
Free fonts used:
- Helvetica (System Font)
- Calibri (System Font)