Free iceberg diagram for PowerPoint and Google Slides. Iceberg design with the view of above and below the water parts. Editable graphics with text placeholders.
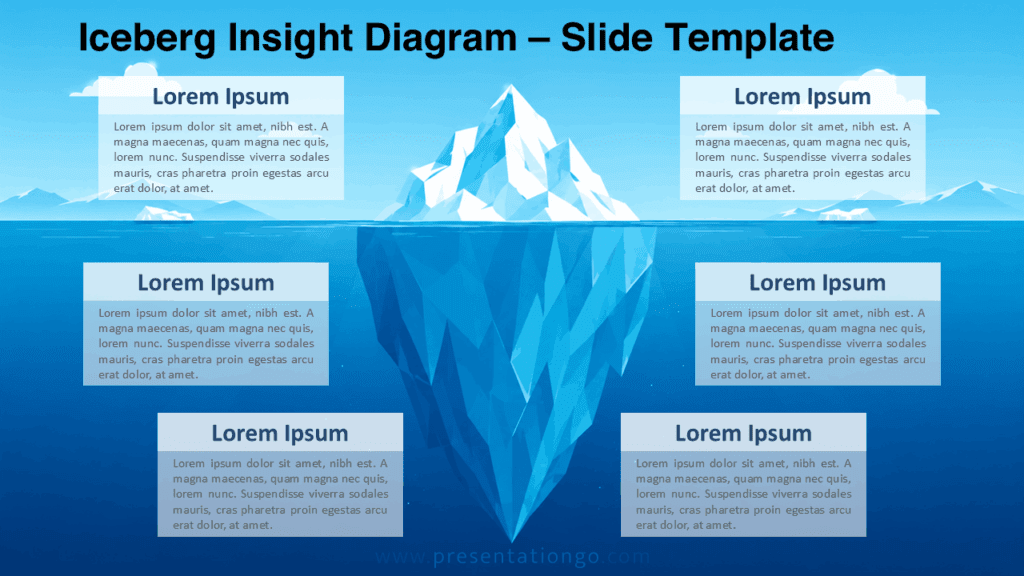
Iceberg Diagram
This diagram for PowerPoint can be used in different business or marketing principles, and even in psychology, and other different areas, like writing. Basically, the iceberg analogy AKA as the iceberg principle or the iceberg theory, is used to illustrate that only a very small amount (the ‘tip’) of information is available or visible, whereas the ‘real’ information is either unavailable or hidden from direct observation.
Shapes are 100% editable: colors and sizes can be easily changed.
The “Lorem Ipsum” text is for illustrative purposes only. Therefore, you should edit it to fit your own needs.
Includes 2 slide option designs: Standard (4:3) and Widescreen (16:9).
Widescreen (16:9) size preview:

This ‘Iceberg Diagram for PowerPoint and Google Slides’ features:
- 1 unique slide
- Ready to use template with text placeholders
- Completely editable shapes
- Standard (4:3) and Widescreen (16:9) aspect ratios
- PPTX file and for Google Slides
Free fonts used:
- Helvetica (System Font)
- Calibri (System Font)


Comments are closed.