The Iceberg Insight Diagram helps you explain visible issues and hidden causes in a clear visual way. It uses a central iceberg metaphor to show what appears above the surface and what remains unseen below. This layout works well for business analysis, risk reviews, root cause discussions, and strategic planning sessions.
Diagram Preview

Diagram Features and Customization Options
- Includes one iceberg-themed presentation slide for PowerPoint and Google Slides.
- Uses surrounding text areas to organize insights, risks, causes, or key findings.
- Lets you edit the text placeholders to match your topic, message, or audience.
- Keeps the iceberg illustration fixed, so only the text content should be customized.
- Combines a clear ocean scene with a strong business metaphor.
- Works for strategy meetings, consulting decks, training sessions, and workshops.
Design and Structure
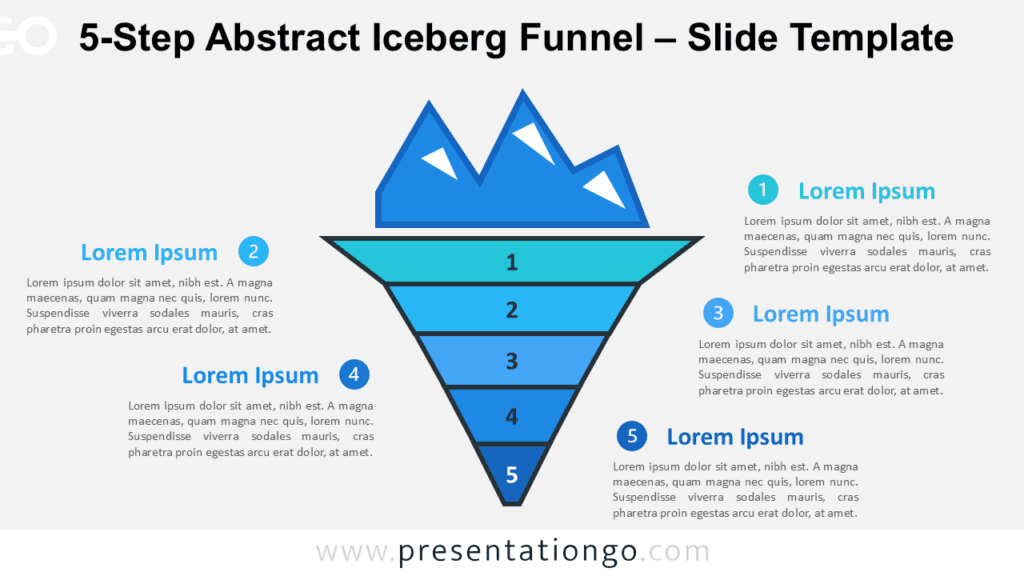
The Iceberg Insight Diagram places a large iceberg at the center of the slide. The visible peak rises above the water, while the larger hidden mass extends below the surface. This visual contrast supports a simple message: some problems look small, but their deeper causes can be much larger.
Six translucent text blocks surround the illustration. Each block includes a title area and a short paragraph area. This structure gives you enough space to describe multiple causes, risks, assumptions, or insights. The balanced layout keeps the focus on the iceberg while making each explanation easy to scan.
The blue color palette creates a calm and analytical mood. Bright sky tones, deep ocean shades, and crisp ice highlights give the slide a polished visual style. The navy typography adds contrast and keeps the content readable during meetings or live presentations.
Practical Applications
- Explain root causes behind a visible business problem.
- Present hidden risks during project or strategy reviews.
- Compare surface-level symptoms with deeper organizational issues.
- Structure discovery findings in consulting or research presentations.
- Support workshops about change management, operations, or performance gaps.
- Show hidden costs, barriers, assumptions, or dependencies.
Summary
The Iceberg Insight Diagram gives presenters a strong metaphor for explaining what lies beneath visible results. It helps audiences understand hidden causes, deeper risks, and complex relationships without heavy text. Use it when you need a clear PowerPoint and Google Slides visual for insight-driven analysis.