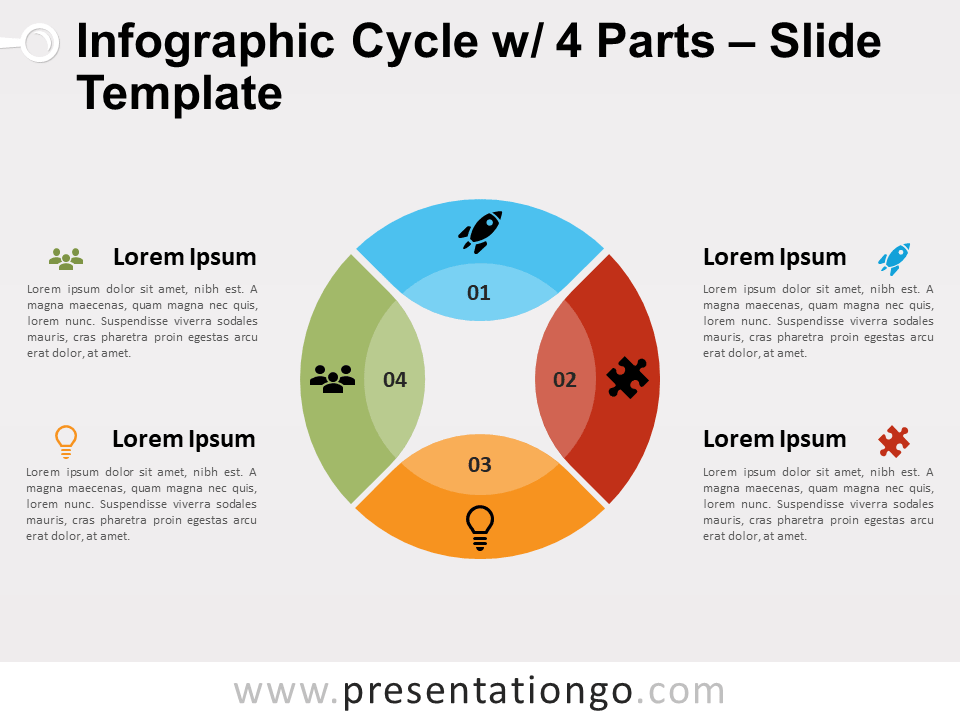
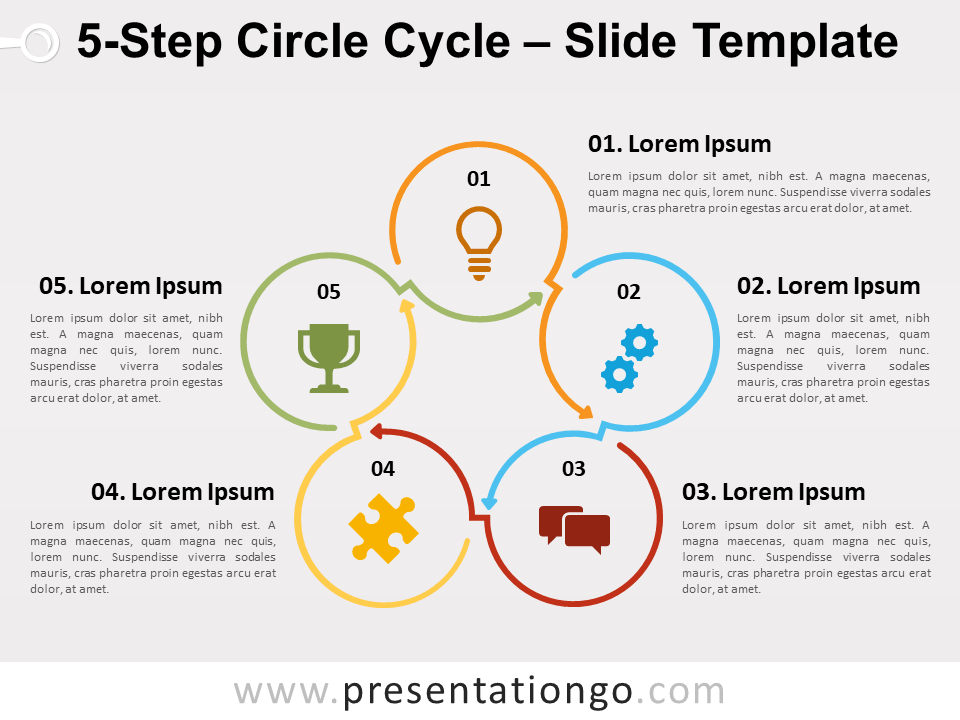
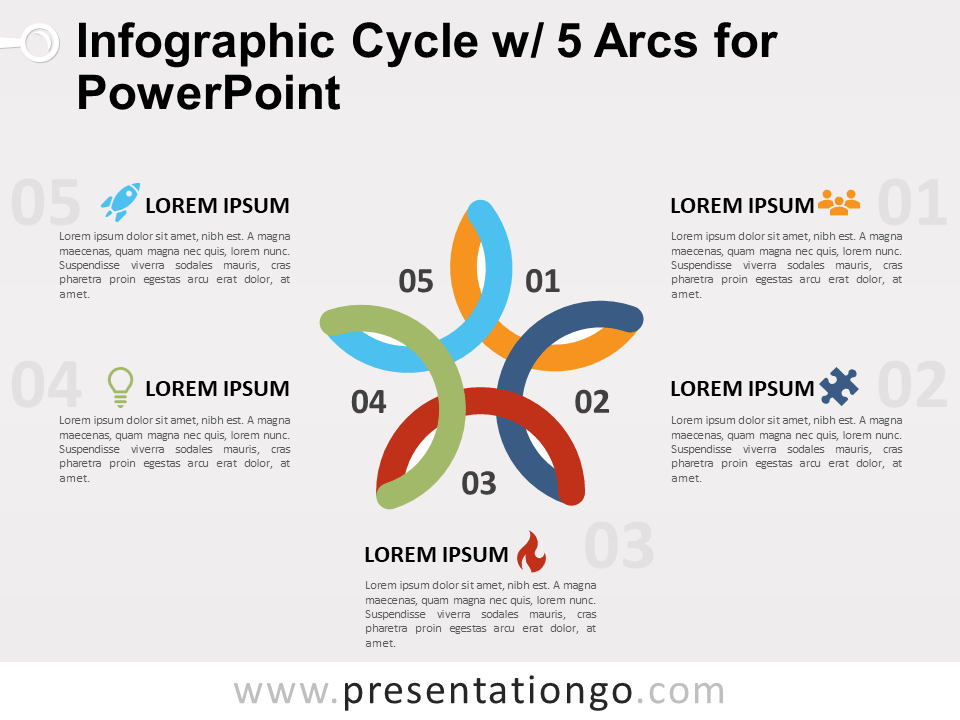
Free infographic cycle with 5 parts for PowerPoint and Google Slides. An elegant colorful cyclic process that illustrates a series of 5 steps. Editable graphics with numbers, icons, and text placeholders.
Infographic Cycle with 5 Parts
A cycle diagram is a circular graphic that illustrates a series of events or steps in a circular flow. Each of its pieces represents a different phase of a cyclic process.
This elegant infographic cycle is designed with 5 petal-shape elements. In addition, there is another smaller petal shape on the inner side of each shape, with a transparency color (2 options, darker or lighter). These subtle inner shapes create a global visual effect, like a transparent circle shape extra layer above the diagram. Also, the negative space forms an interesting five-pointed star shape in the middle of the diagram.
For example, you can use it to represent a continuing sequence of 5 steps or parts in a circular flow. The output returns repeatedly influencing the new cycle.
Shapes are 100% editable: colors and sizes can be easily changed.
Includes 2 slide option designs: Standard (4:3) and Widescreen (16:9).
Widescreen (16:9) size preview:
This ‘Infographic Cycle with 5 Parts for PowerPoint and Google Slides’ features:
- 3 unique slides
- Light and Dark layout
- Ready to use template with numbers, icons, and text placeholders
- Completely editable shapes
- Uses a selection of editable PowerPoint icons
- Standard (4:3) and Widescreen (16:9) aspect ratios
- PPTX file and for Google Slides
Free fonts used:
- Helvetica (System Font)
- Calibri (System Font)


