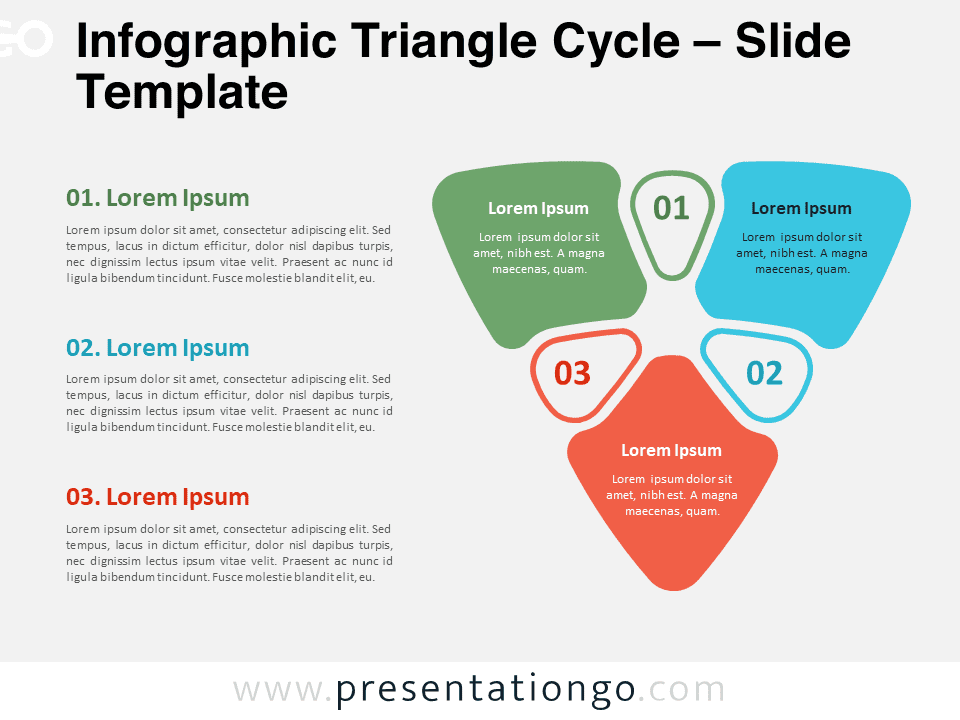
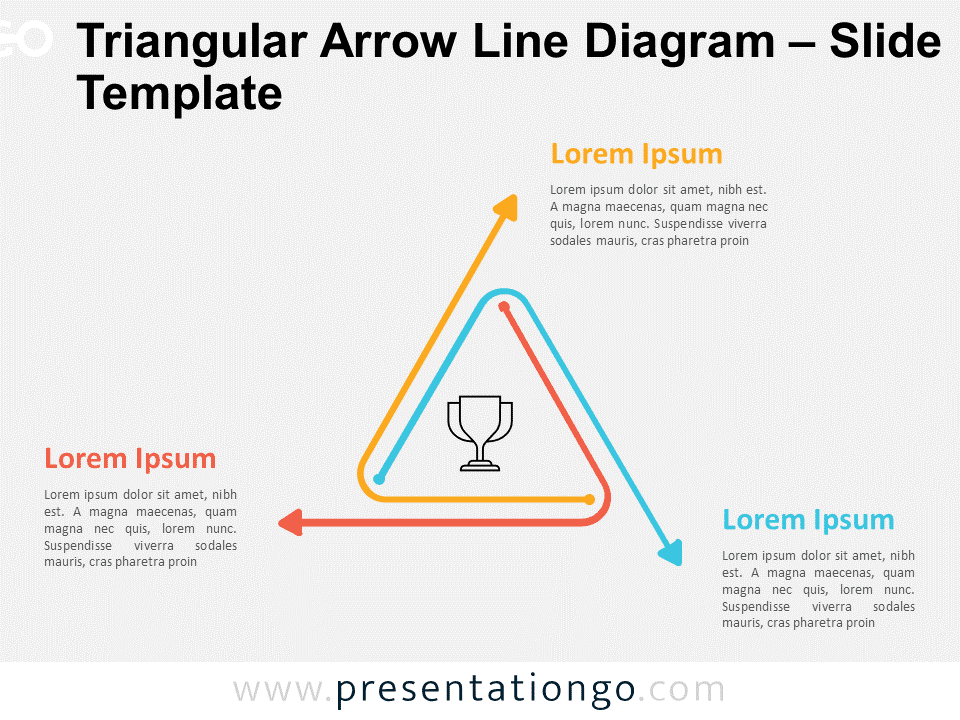
The Infographic Triangle Cycle is a 3-step cyclical diagram template for PowerPoint and Google Slides. Ideal design for diagramming continuous processes.
3-Step Cyclical Diagram for Continuous Process Visualization
Cycle diagrams are a common visual tool used to represent cyclical processes or sequential steps. The Infographic Triangle Cycle takes this concept a step further with a unique triangular design composed of three rounded shapes. Numbers positioned between each shape clearly indicate the order of the steps, making it easy for viewers to follow your presentation flow.
This template is perfect for outlining business cycles, project phases, or any iterative process in professional settings. For example, the Infographic Triangle Cycle’s three-step visual format makes it perfect for showcasing the key components of your Customer Value Proposition: Needs, Value Offered, and Target Customers. This cycle diagram can also be effectively used to present your Objectives and Key Results (OKRs) by outlining your Objective, then detailing the two key results you’ll track to achieve that objective.
This presentation document includes two unique slides, each equipped with number markers and text placeholders. Shapes are fully customizable, allowing users to adapt the diagram to their specific needs. The template supports both light and dark themes and is available in Standard (4:3) and Widescreen (16:9) formats for PowerPoint PPTX and Google Slides.
Download this Infographic Triangle Cycle template to create professional, impactful presentations that effectively communicate your 3-step processes or cycles.
Widescreen (16:9) size preview:
This template offers:
- 2 unique slides
- Options for both light and dark themes
- Pre-populated with numbers and text placeholders
- Fully customizable shapes for complete control
- Available in both Standard (4:3) and Widescreen (16:9) ratios
- Offered in both PowerPoint PPTX and Google Slides formats


