

The Japan Dotted Map Infographic is a clean and modern visual tool designed to help you present geographic data with clarity and impact. Built with evenly spaced dots forming the silhouette of Japan, this infographic offers a professional way to highlight locations, percentages, and regional insights in both PowerPoint and Google Slides.
This dotted map design focuses on readability and flexibility. It allows presenters to communicate complex geographic information without overwhelming the audience. Whether you are working on business reports, market analysis, or educational content, this infographic adapts easily to your presentation goals.
Dotted Map Preview
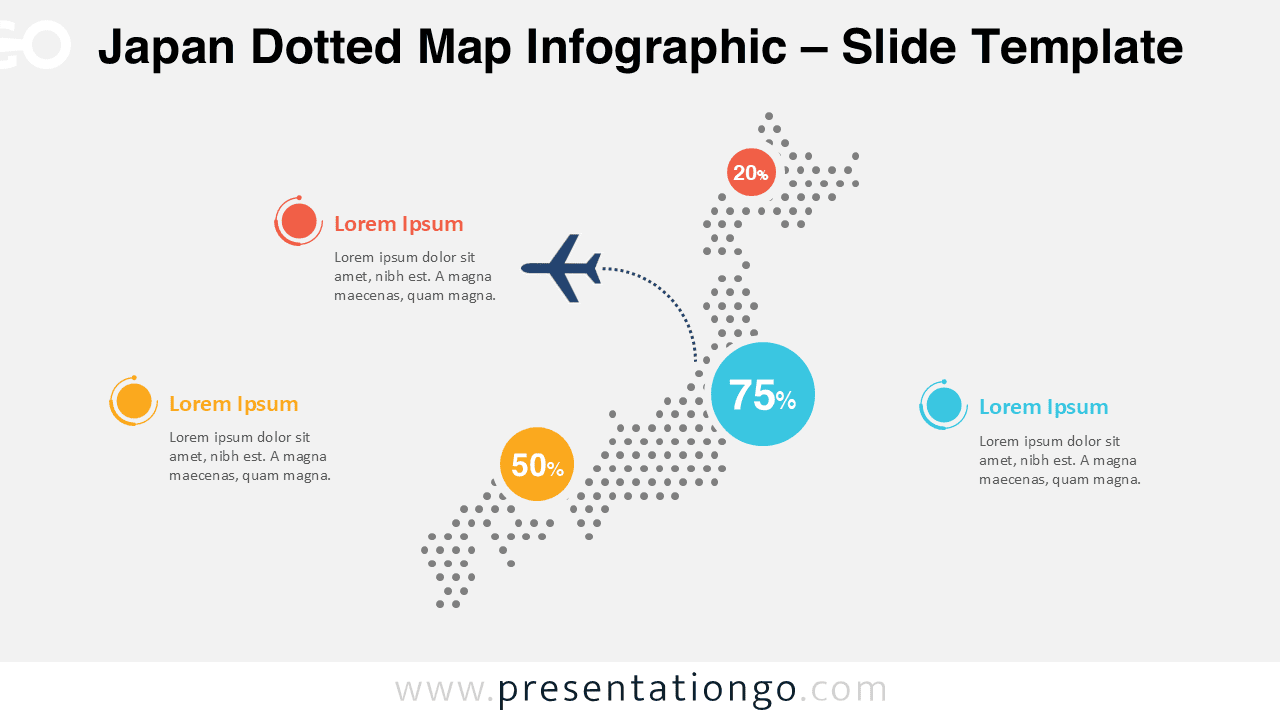
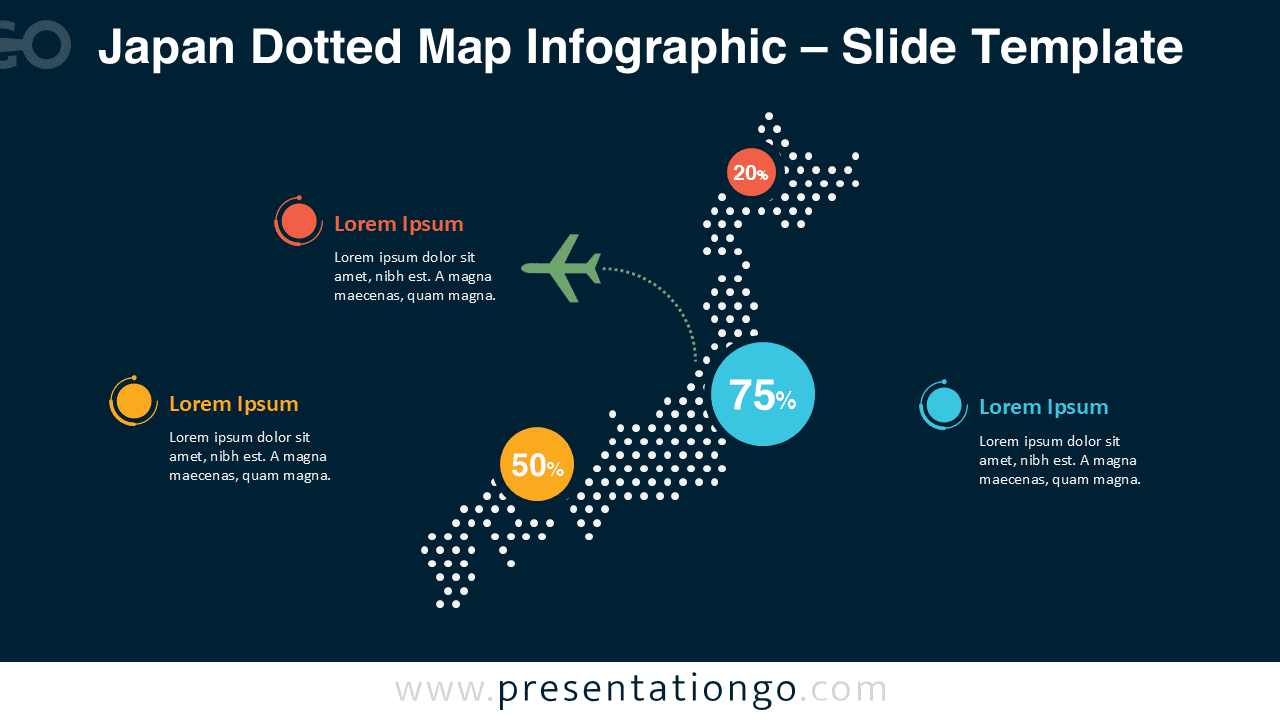


Diagram Features and Customization Options
- Editable dotted map shapes built with clean, scalable vector elements
- Fully editable arrows, connectors, and callout shapes for annotations
- Customizable text placeholders for labels, values, and descriptions
- Light and dark background versions included for design flexibility
- Easy color customization to match your branding or presentation theme
- Compatible with both PowerPoint and Google Slides
Design and Structure
The map of Japan is constructed using consistent dot spacing to ensure visual balance and precision. Percentage markers and callouts are placed strategically to guide the viewer’s eye across the map. The design maintains strong contrast in both light and dark versions, ensuring readability in meeting rooms, classrooms, and online presentations.
All elements are vector-based, which means they remain sharp and clear at any size. You can resize, recolor, or reposition elements without losing quality or alignment.
Practical Applications
- Market presence and regional performance analysis in Japan
- Business expansion, logistics, and distribution mapping
- Statistical reporting and geographic data visualization
- Educational presentations focused on Japanese geography
- Travel, tourism, or infrastructure overviews
Summary
The Japan Dotted Map Infographic provides a versatile and professional solution for geographic presentations. With fully editable elements, dual background versions, and compatibility with PowerPoint and Google Slides, it helps you communicate location-based insights clearly and efficiently.



