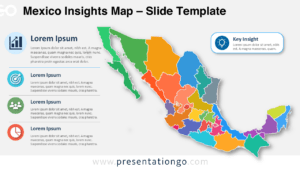
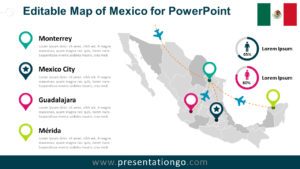
The Mexico Dotted Map Infographic is a clean and professional visual tool designed to help you present geographic data with clarity and impact.
Built for both PowerPoint and Google Slides, this infographic makes it easy to highlight regional insights, statistics, and key locations across Mexico.
Dotted Map Preview
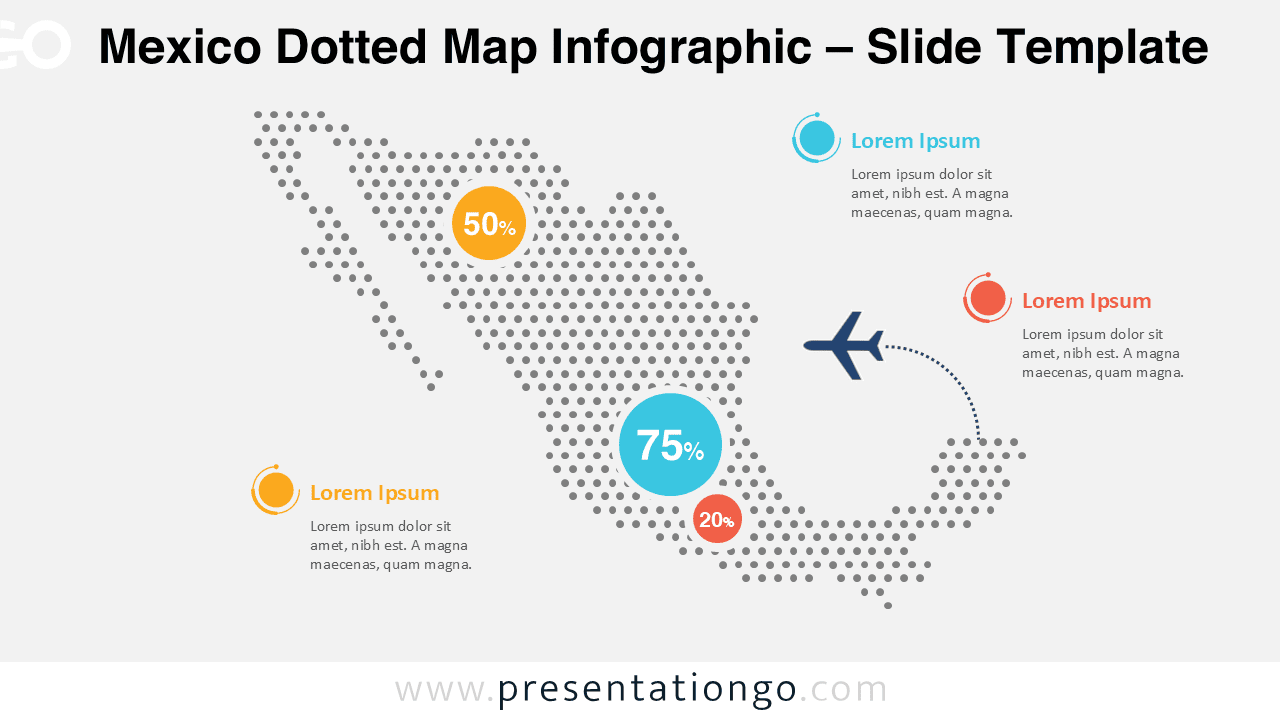
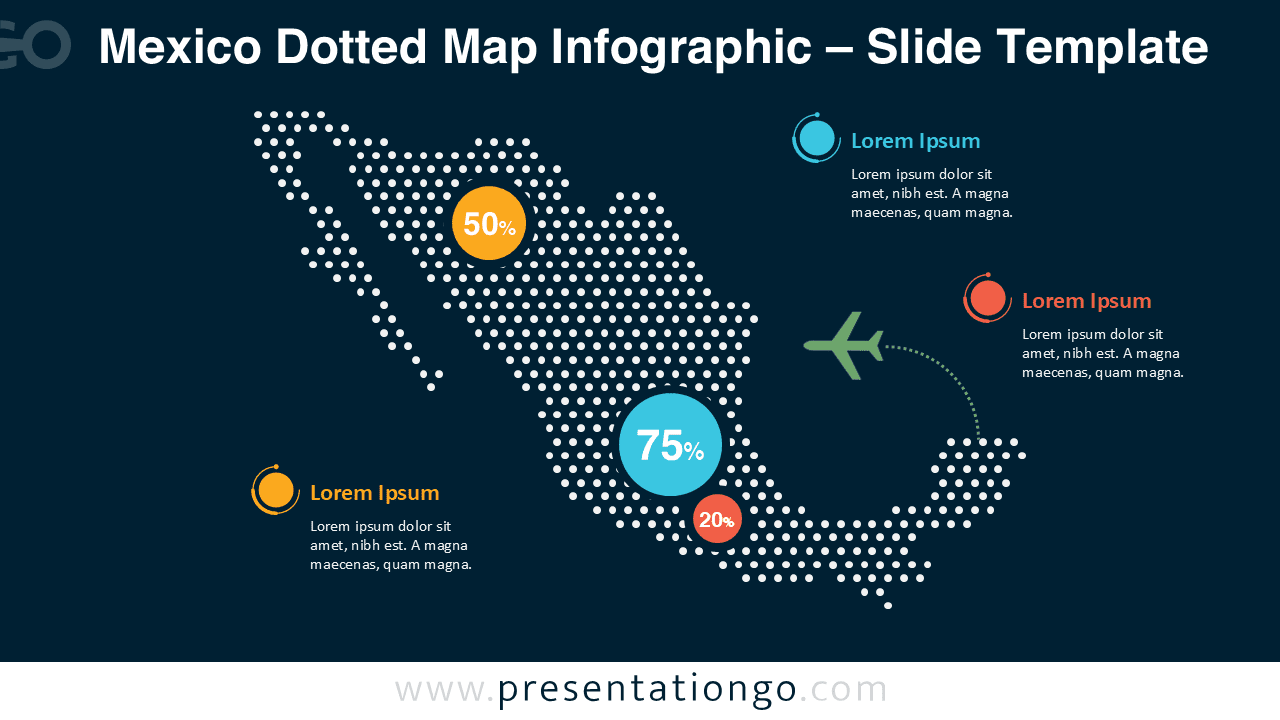
This dotted map design uses evenly spaced vector dots to form the shape of Mexico, ensuring a balanced and modern appearance.
The layout supports data markers, percentage badges, and callouts that help guide attention to specific regions or insights.
Diagram Features and Customization Options
- Editable dotted map vector built with clean, scalable shapes for precise geographic visualization
- Fully editable arrows, curves, and connector elements to highlight regions, flows, or movements
- Customizable text placeholders for labels, percentages, values, and descriptive annotations
- Optional decorative graphic placeholders that can be easily replaced or removed
- Light and dark background versions included to suit different presentation themes
- Simple color customization to match your brand identity or corporate palette
- Fully compatible with PowerPoint and Google Slides with no external fonts or plugins required
Design and Structure
The infographic features a central dotted map of Mexico surrounded by clean callout areas for explanations and metrics. Accent colors are used sparingly to emphasize data points without overwhelming the overall composition. Both light and dark versions preserve contrast and readability, making the design adaptable to various presentation environments.
Practical Applications
- Business presentations showing regional performance or market distribution
- Educational materials focused on geography or demographic analysis
- Logistics and transportation planning across Mexico
- Government or public sector reporting
- Tourism, travel, or infrastructure overviews
Summary
The Mexico Dotted Map Infographic provides a clear and flexible way to communicate geographic information.
With editable vectors, dual background options, and full compatibility with PowerPoint and Google Slides, it is a practical solution for professional and educational use.