The PDCA Cycle (Plan-Do-Check-Act) provides a four-step continuous improvement framework designed for PowerPoint and Google Slides presentations.
Showcasing Quality Management with the PDCA Diagram
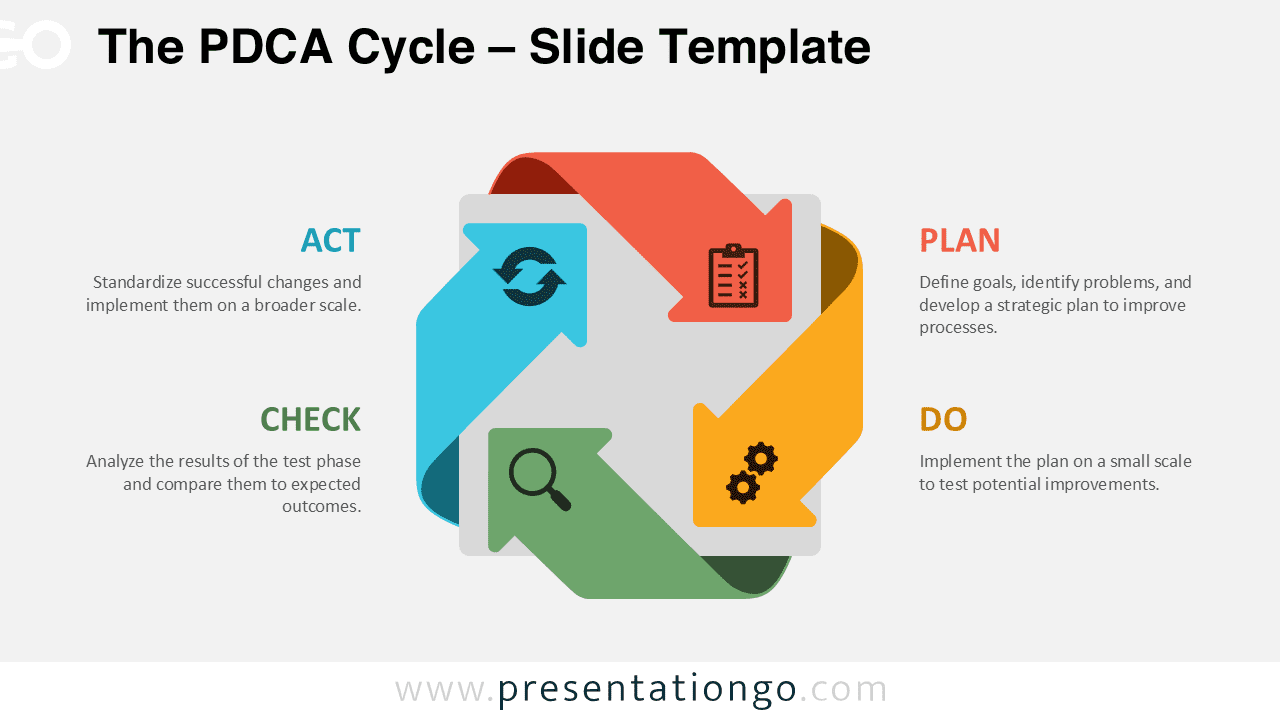
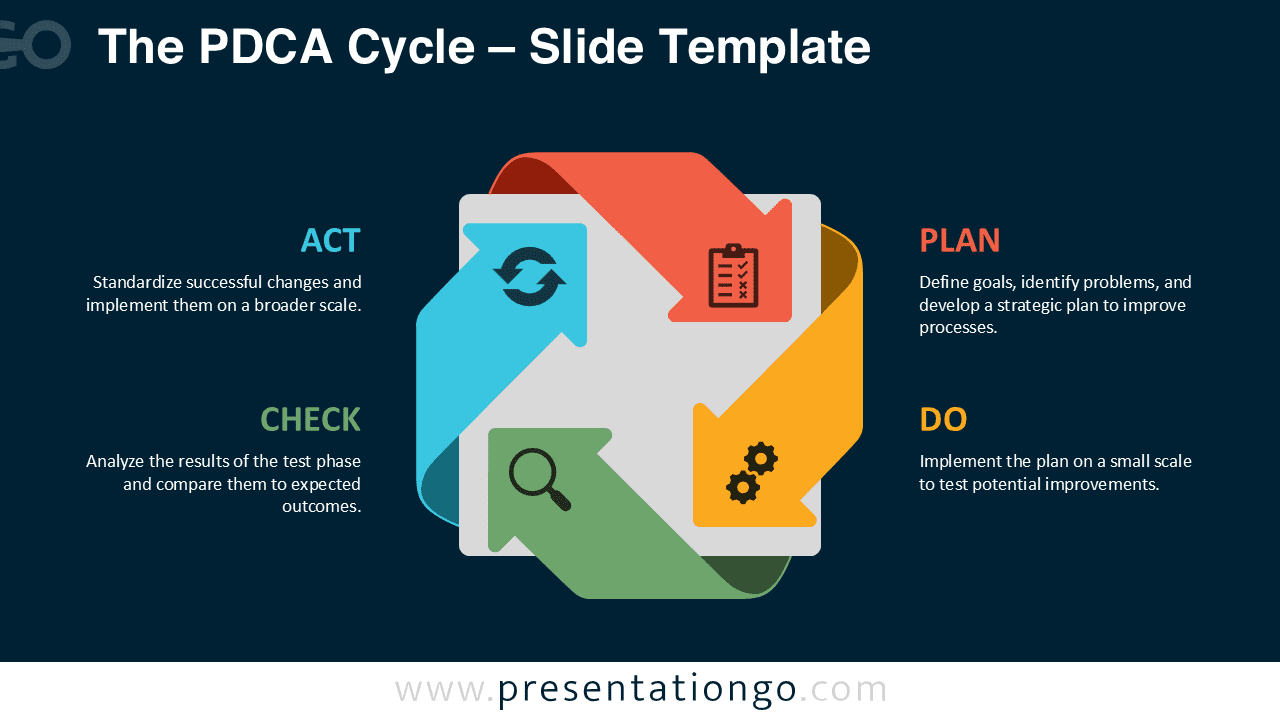
The diagram presents a closed-loop square cycle composed of four curved arrows that rotate clockwise. Each arrow is color-coded and labeled to reflect a specific phase of the PDCA method—Plan (red, top-right), Do (yellow, bottom-right), Check (green, bottom-left), and Act (blue, top-left). Every segment includes a modern flat-design icon—a clipboard, gears, a magnifying glass, and a circular arrow—clearly representing each stage. These components surround a central square that subtly reinforces the ongoing process. Each quadrant contains its respective title and a short, color-coded description positioned for symmetry and ease of reading.
The Plan-Do-Check-Act cycle represents a four-phase management method for continuous improvement and problem-solving in business operations. Plan involves identifying problems and developing solutions, Do focuses on implementing changes on a small scale, Check evaluates results against expected outcomes, and Act standardizes successful improvements for broader implementation. Organizations use this methodology to systematically improve processes, solve problems, and enhance quality management initiatives. This diagram excels in business presentations where teams need to visualize continuous improvement cycles, demonstrate quality control processes, or explain project management methodologies. Additionally, the template proves particularly valuable for training sessions, strategic planning meetings, and operational reviews where stakeholders must understand iterative improvement approaches. The color-coded design helps audiences quickly identify each phase while maintaining engagement throughout complex process explanations.
This template consists of two slides, each pre-designed with visual icons and editable text boxes. You can easily change colors and rearrange elements. It’s available in both light and dark themes and formatted for 4:3 and 16:9 displays. Whether you use PowerPoint or Google Slides, the file is compatible and easy to customize to fit your branding or instructional style.
Download this four-part PDCA cycle diagram with two layout options for seamless process presentations.
Widescreen (16:9) size preview:


This template offers:
- 4 unique slides
- Pre-populated with icons and text placeholders
- Fully customizable shapes for complete control
- Available in both Standard (4:3) and Widescreen (16:9) ratios
- Offered in both PowerPoint PPTX and Google Slides formats