Free pie-chart infographic for PowerPoint. Colored graphic design with 8 parts or steps. Editable graphics with text placeholder.
Pie-Chart Infographic
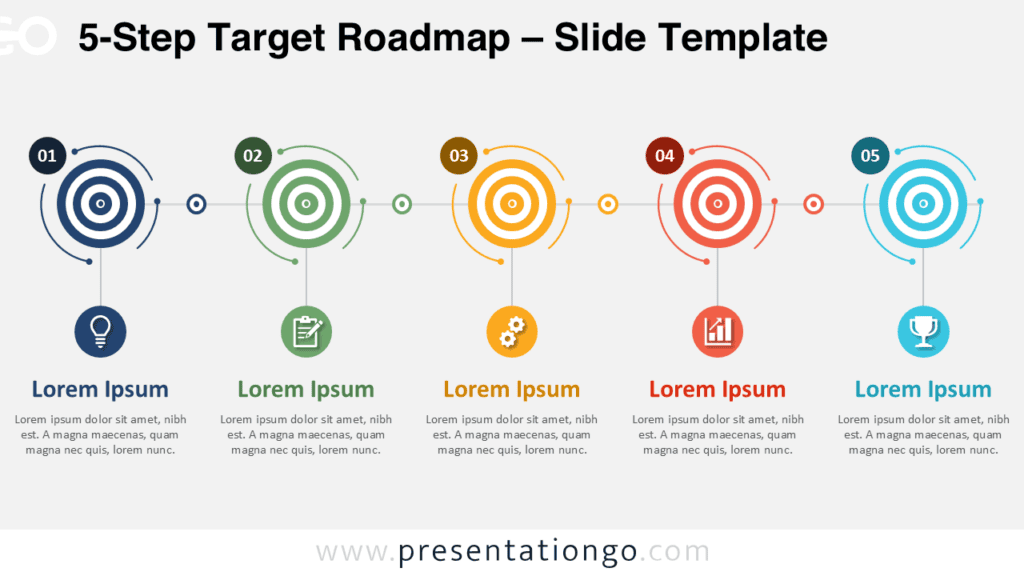
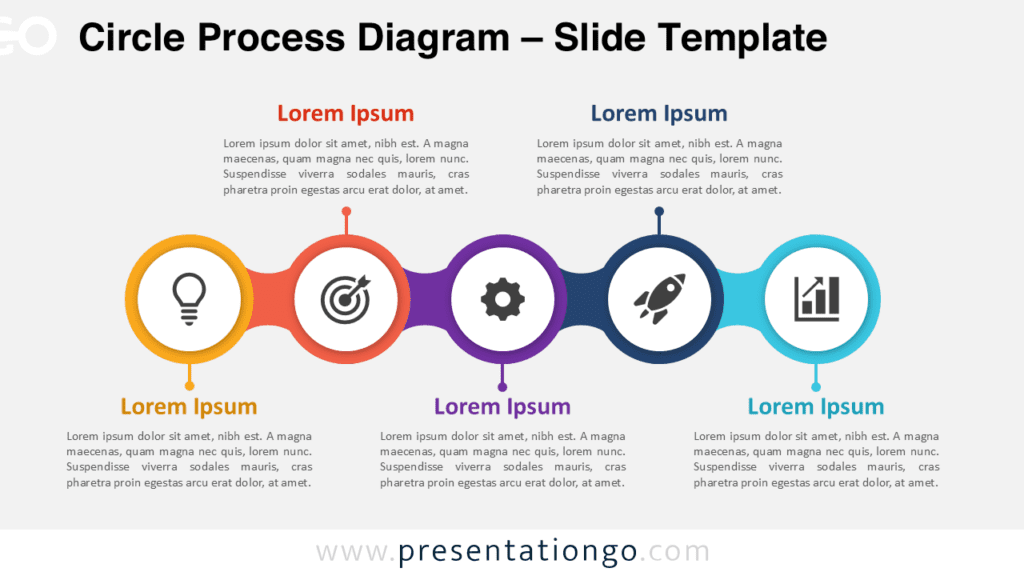
Use this diagram to represent a continuing sequence of stages, tasks, or events in a circular and increasing flow. Emphasizes the interconnected pieces, and growing importance of each part.
Note: this chart is not data-driven.
Shapes are 100% editable: colors and sizes can be easily changed.
Includes 2 slide option designs: Standard (4:3) and Widescreen (16:9).
Widescreen (16:9) size preview:


This ‘Pie-Chart Infographic for PowerPoint’ features:
- 2 unique slides
- Light and Dark layout
- Ready to use template with text placeholder
- Completely editable shapes
- Standard (4:3) and Widescreen (16:9) aspect ratios
- PPTX file
Free fonts used:
- Helvetica (System Font)
- Calibri (System Font)


Comments are closed.