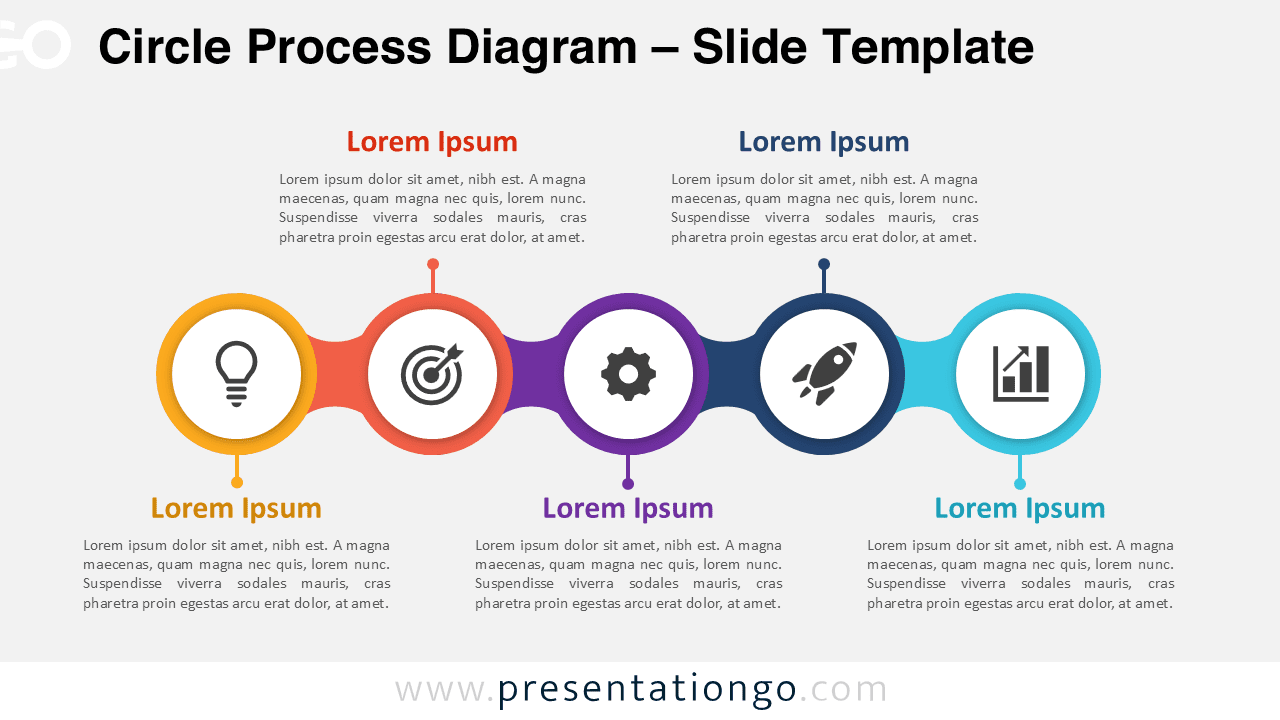
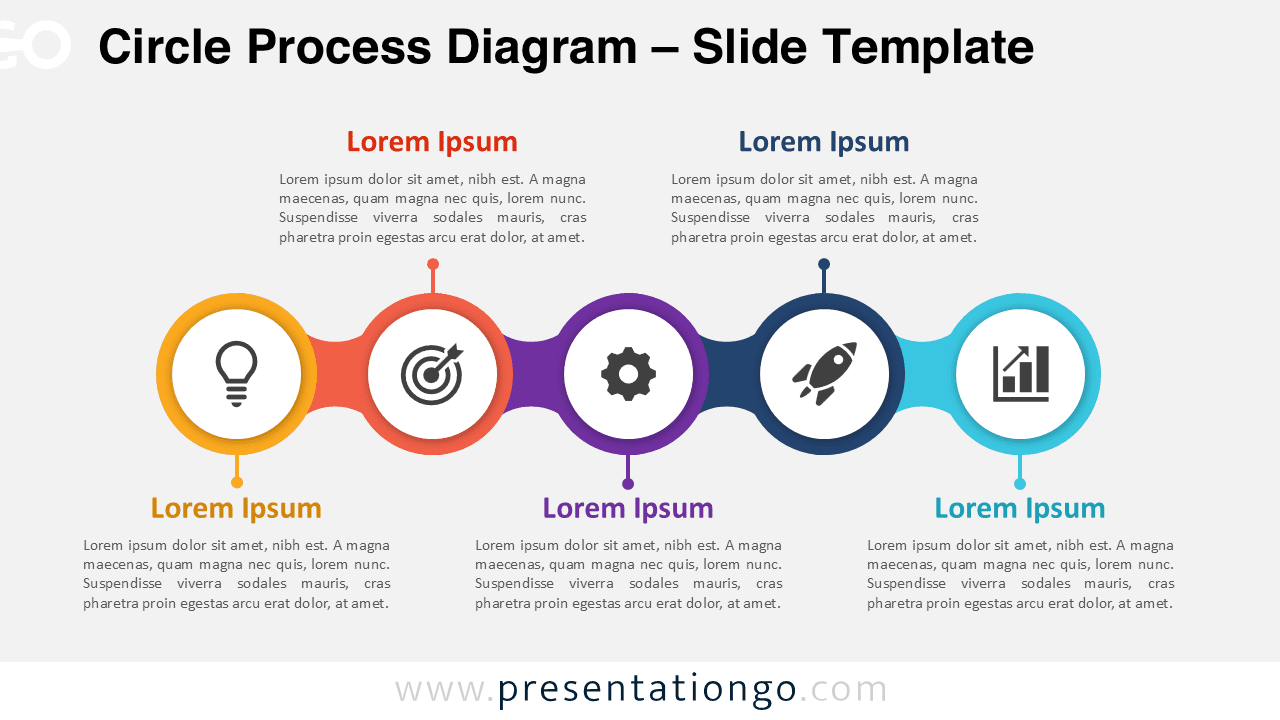
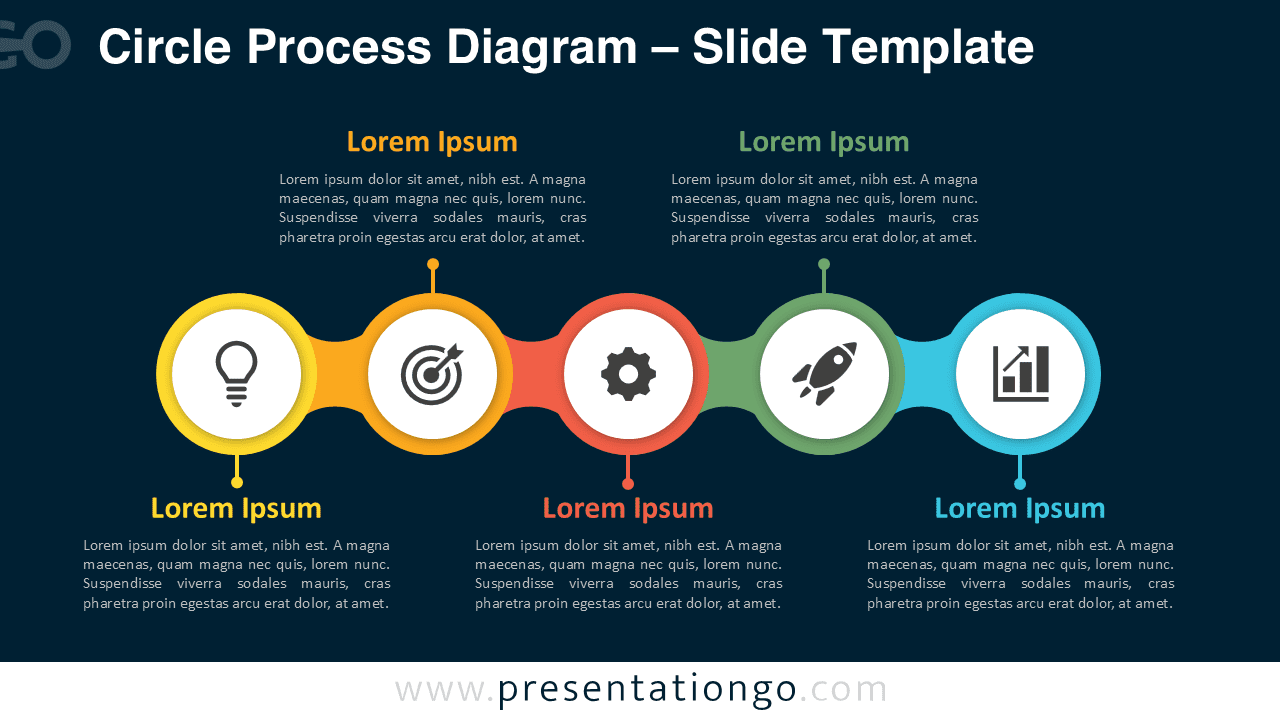
The Circle Process Diagram helps you present a five-step sequence with clarity and impact. Use it to explain workflows, milestones, strategic phases, or project stages in PowerPoint and Google Slides. Its connected circle layout guides the audience from one idea to the next, while each icon helps viewers recognize the purpose of every step quickly.
Diagram Preview


Features and Customization Options
- Includes five connected circle stages for structured process storytelling.
- Works with PowerPoint and Google Slides for easy editing.
- Uses editable shapes, connectors, labels, and text placeholders.
- Includes icons from the Office icon library, easily modifiable for your needs.
- Lets you replace icons with other Office library icons or custom visuals.
- Supports business, education, marketing, strategy, and project presentations.
- Provides a clear horizontal flow for step-by-step explanations.
Design and Structure
This Circle Process Diagram uses a simple left-to-right structure that makes progression easy to follow. Each stage appears inside a circular node, with a central icon and nearby text area. This layout keeps the message organized and helps the presenter separate ideas without losing the overall flow. You can edit every stage directly, update the labels, change the icons, and adjust the content to match your presentation goals.
Practical Applications
- Present a five-step business process or operational workflow.
- Explain project phases from idea generation to measurable results.
- Show a product development path, campaign sequence, or launch plan.
- Break down a strategic roadmap into simple, visual milestones.
- Use the icons as visual anchors for brainstorming, planning, and reporting.
Summary
The Circle Process Diagram gives you a flexible visual framework for explaining connected stages. It combines editable text, shapes, connectors, and Office library icons in one clean structure. Use it when you need to turn a sequence into a clear story. This diagram helps teams present processes faster, keep audiences focused, and adapt each stage to their own message.