Skip to content
PresentationGO
  • Explore
    • Templates
      • Abstract
      • Sports
      • Business
      • Religion & Holidays
      • Nature
      • Technology
      • Professions
      • Flat Lays & Scenes
      • Health & Recreation
      • Color Palettes
      • Education
      • Food & Drink
      • Science
      • CertificatesNEW
      • All Templates
    • Charts & Diagrams
      • Processes
        • Circular
        • Linear
        • Alternating
        • Stairs
        • Bending
      • Funnels
      • Pyramids
      • Matrix Charts
      • Business Models
      • Non-Data-Driven Chart Alternatives
      • Radial Diagrams
      • Flow Charts
      • Data-Driven Charts & Graphs
      • Organizational Charts
      • Clusters & Relationships
      • Venn Diagrams
      • All Charts & Diagrams
    • Text & Tables
      • Text Boxes
      • Comparisons
      • Paper & Banners
      • Numbered Lists
      • Speaking Bubbles
      • Pricing Tables
      • Bullet Point / Text Layouts
      • Contents & Table of Contents
      • Quotes
      • Word Clouds
      • To-do & Checklists
      • All Text & Tables
    • Timelines & Planning
      • Calendars
      • Timelines
      • Gantt Charts
      • Agenda
      • All Timelines & Planning
    • Graphics & Metaphors
      • Concepts
      • Silhouettes & People
      • Light Bulbs
      • Trees
      • Letters & Numbers
      • Signs
      • Mockups
      • Food
      • Money
      • Road
      • Target and Goals
      • All Graphics & Metaphors
    • Maps & Flags
      • Flag Templates
      • Continent Maps
      • Country Maps
        • Africa
        • Asia
        • Australia / Oceania
        • Europe
        • North America
        • South America
      • World Maps
      • All Maps
    • AI ImagesNEW
  • Search by
    • Colors
      • Black
      • Blue
      • Brown
      • Gray
      • Green
      • Light Blue
      • Orange
      • Pink
      • Purple
      • Red
      • White
      • Yellow
    • Steps (Options)
      • 2 options
      • 3 options
      • 4 options
      • 5 options
      • 6 options
      • 7 options
      • 8 options
      • 9 options
      • 10 options
      • 12 options
  • Templates
  • Charts & Diagrams
  • Text & Tables
  • Timelines & Planning
  • Graphics & Metaphors
  • Maps & Flags
  • AI ImagesNEW

Circular

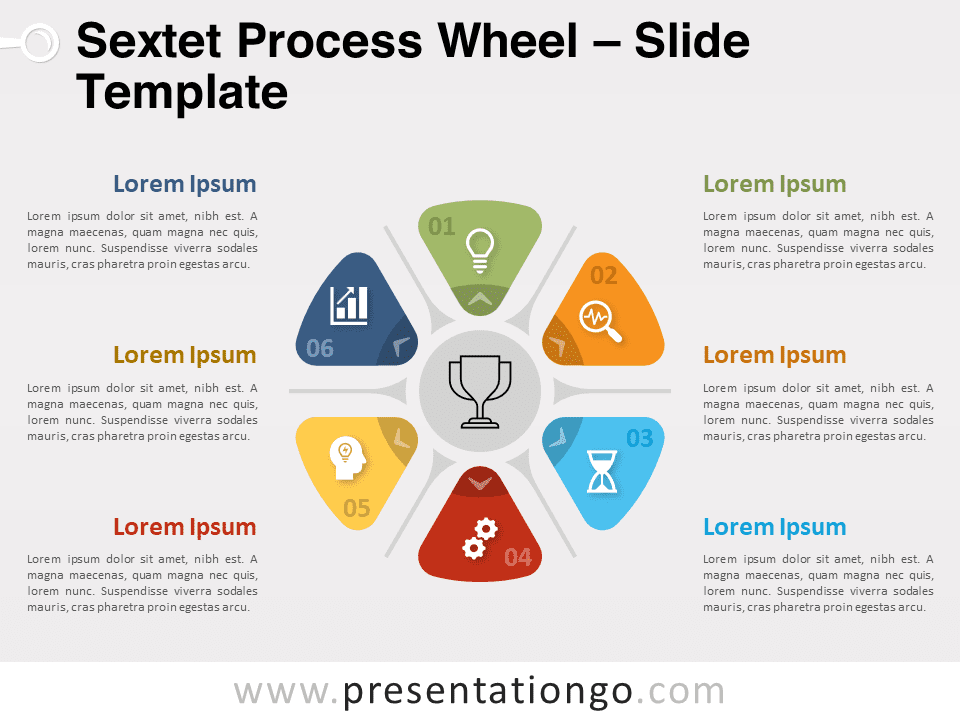
Discover our versatile range of circular diagrams and charts, specially designed for PowerPoint and Google Slides. This collection is tailored to visually represent circular flows, cycles, and process cycles in a clear and engaging manner.

Ideal for business presentations, educational materials, or any scenario requiring the depiction of cyclical processes, our templates are both user-friendly and highly customizable. Dive into our extensive library to find the perfect circular diagram that enhances your presentation’s clarity and visual impact.

Free Eightfold Windmill Wheel for PowerPoint
Charts & Diagrams
8 options

Eightfold Windmill Wheel for PowerPoint and Google Slides

Elevate presentations with the Eightfold Windmill Wheel for PowerPoint & Google Slides. Link eight ideas around a core theme, ideal for business strategies.

Google Slides, PPTX

4:316:9

Free Sixfold Windmill Wheel for PowerPoint
Charts & Diagrams
6 options

Sixfold Windmill Wheel for PowerPoint and Google Slides

Boost presentations with the Sixfold Windmill Wheel for PowerPoint & Google Slides. Display six steps or ideas converging on a central theme.

Google Slides, PPTX

4:316:9

Free Quad Windmill Wheel for PowerPoint
Charts & Diagrams
4 options

Quad Windmill Wheel for PowerPoint and Google Slides

Elevate your presentations with the Quad Windmill Wheel for PowerPoint and Google Slides. Showcase 4 stages and tasks around a central theme.

Google Slides, PPTX

4:316:9

Free Eight Radiating Blades for PowerPoint
Charts & Diagrams
8 options

Eight Radiating Blades for PowerPoint and Google Slides

Discover a captivating "Eight Radiating Blades" visual aid for PowerPoint and Google Slides. Highlight a central idea and its 8 interconnected facets.

Google Slides, PPTX

4:316:9

Free Four Radiating Blades for PowerPoint
Charts & Diagrams
4 options

Four Radiating Blades for PowerPoint and Google Slides

Free versatile "Four Radiating Blades" slide template for PowerPoint and Google Slides. Ideal for showcasing a central theme and its four related components.

Google Slides, PPTX

4:316:9

Free Hexagon Cycle Radial for PowerPoint
Charts & Diagrams
6 options

Hexagon Cycle Radial for PowerPoint and Google Slides

Discover our Hexagon Cycle Radial for PowerPoint and Google Slides - a versatile graphic to showcase interconnected elements around a central idea.

Google Slides, PPTX

4:316:9

Free Infinity Loop Process with Dual Cycles for PowerPoint
Charts & Diagrams
8 options

Infinity Loop Process with Dual Cycles for PowerPoint and Google Slides

The "Infinity Loop Process with Dual Cycles" is a free diagram for PowerPoint and Google Slides. Perfect for complex processes or cycles.

Google Slides, PPTX

4:316:9

A multi-level doughnut chart for PowerPoint featuring an inner circle at the center, divided into six distinct parts, and surrounded by an outer circle, where each section of the inner circle is further split into two equal parts.
Charts & Diagrams

6×2 Two-Level Chart for PowerPoint and Google Slides

Showcase intricate, interconnected ideas in your presentations using the 6x2 Two-Level Chart for PowerPoint and Google Slides.

Google Slides, PPTX

4:316:9

A multi-level doughnut chart for PowerPoint featuring an inner circle at the center, divided into five distinct parts, and surrounded by an outer circle, where each section of the inner circle is further split into two equal parts.
Charts & Diagrams

5×2 Two-Level Chart for PowerPoint and Google Slides

The versatile 5x2 Two-Level Chart template for PowerPoint and Google Slides will elevate your presentations with its modern and intuitive design.

Google Slides, PPTX

4:316:9

A multi-level doughnut chart for PowerPoint featuring an inner circle at the center, divided into four distinct parts, and surrounded by an outer circle, where each section of the inner circle is further split into two equal parts.
Charts & Diagrams

4×2 Two-Level Chart for PowerPoint and Google Slides

This free 4x2 Two-Level Chart for PowerPoint and Google Slides will showcase hierarchies and complex relationships. Editable graphics.

Google Slides, PPTX

4:316:9

A multi-level doughnut chart for PowerPoint featuring an inner circle at the center, divided into four distinct parts, and surrounded by an outer circle, where each section of the inner circle is further split into three equal parts.
Charts & Diagrams

4×3 Two-Level Chart for PowerPoint and Google Slides

This free 4x3 Two-Level Chart for PowerPoint and Google Slides will help you complex, interconnected ideas, and hierarchies effectively.

Google Slides, PPTX

4:316:9

A multi-level doughnut chart for PowerPoint featuring an inner circle at the center, divided into three distinct parts, and surrounded by an outer circle, where each section of the inner circle is further split into two equal parts.
Charts & Diagrams

3×2 Two-Level Chart for PowerPoint and Google Slides

The 3x2 Two-Level Chart for PowerPoint and Google Slides is multi-level doughnut chart to simplify the presentation of interconnected ideas.

Google Slides, PPTX

4:316:9

Older posts
Newer posts
← Previous Page1 … Page8 Page9 Page10 … Page38 Next →
Search Templates by categories
Templates Charts & Diagrams Text & Tables Maps & Flags Timelines & Planning Graphics & Metaphors
Search Templates by colors
Support us
icon of a coffee cup for 'support us' - PresentationGo
... buying us a coffee

Love our templates? Show your support with a coffee!

Donate Here

Thank you for fueling our creativity!

Logotype PresentationGo
Content

Templates

Charts & Diagrams

Text & Tables

Graphics & Metaphors

Timelines & Planning

Maps

AI ImagesNEW

Best-Ofs & Tips

Legal

Terms and Conditions

Privacy Statement

Cookie Policy

Digital Millennium Copyright Act (DMCA) Policy

Disclaimer

Help

Contact us

FAQ

Templates

Charts & Diagrams

Text & Tables

Graphics & Metaphors

Timelines & Planning

Maps

Best-Ofs & Tips

Terms and Conditions

Privacy Statement

Cookie Policy

Digital Millennium Copyright Act (DMCA) Policy

Disclaimer

Contact us

FAQ

© Copyright 2025 Ofeex | PRESENTATIONGO® is a registered trademark | All rights reserved.

PresentationGO
Manage your privacy

To provide the best experiences, we and our partners use technologies like cookies to store and/or access device information. Consenting to these technologies will allow us and our partners to process personal data such as browsing behavior or unique IDs on this site and show (non-) personalized ads. Not consenting or withdrawing consent, may adversely affect certain features and functions.

Click below to consent to the above or make granular choices. Your choices will be applied to this site only. You can change your settings at any time, including withdrawing your consent, by using the toggles on the Cookie Policy, or by clicking on the manage consent button at the bottom of the screen.

Functional Always active
The technical storage or access is strictly necessary for the legitimate purpose of enabling the use of a specific service explicitly requested by the subscriber or user, or for the sole purpose of carrying out the transmission of a communication over an electronic communications network.
Preferences
The technical storage or access is necessary for the legitimate purpose of storing preferences that are not requested by the subscriber or user.
Statistics
The technical storage or access that is used exclusively for statistical purposes. The technical storage or access that is used exclusively for anonymous statistical purposes. Without a subpoena, voluntary compliance on the part of your Internet Service Provider, or additional records from a third party, information stored or retrieved for this purpose alone cannot usually be used to identify you.
Marketing
The technical storage or access is required to create user profiles to send advertising, or to track the user on a website or across several websites for similar marketing purposes.
Statistics

Marketing

Features
Always active

Always active
Manage options Manage services Manage {vendor_count} vendors Read more about these purposes
Manage preferences
{title} {title} {title}
PresentationGO
Manage your privacy
We use cookies to enhance your browsing experience, serve personalized ads or content, and analyze our traffic. By clicking "Accept", you consent to our use of cookies.
Functional Always active
The technical storage or access is strictly necessary for the legitimate purpose of enabling the use of a specific service explicitly requested by the subscriber or user, or for the sole purpose of carrying out the transmission of a communication over an electronic communications network.
Preferences
The technical storage or access is necessary for the legitimate purpose of storing preferences that are not requested by the subscriber or user.
Statistics
The technical storage or access that is used exclusively for statistical purposes. The technical storage or access that is used exclusively for anonymous statistical purposes. Without a subpoena, voluntary compliance on the part of your Internet Service Provider, or additional records from a third party, information stored or retrieved for this purpose alone cannot usually be used to identify you.
Marketing
The technical storage or access is required to create user profiles to send advertising, or to track the user on a website or across several websites for similar marketing purposes.
Statistics

Marketing

Features
Always active

Always active
Manage options Manage services Manage {vendor_count} vendors Read more about these purposes
Manage preferences
{title} {title} {title}

Thank you for downloading from PresentationGO!

AI Images are free to use with no attribution required (though appreciated).

Presentation templates are also free, but require attribution.
For example, you can include this credit somewhere visible:

If you enjoy our free resources and want to support us, you can:

Buy us a coffee

Thank you for your continued support!