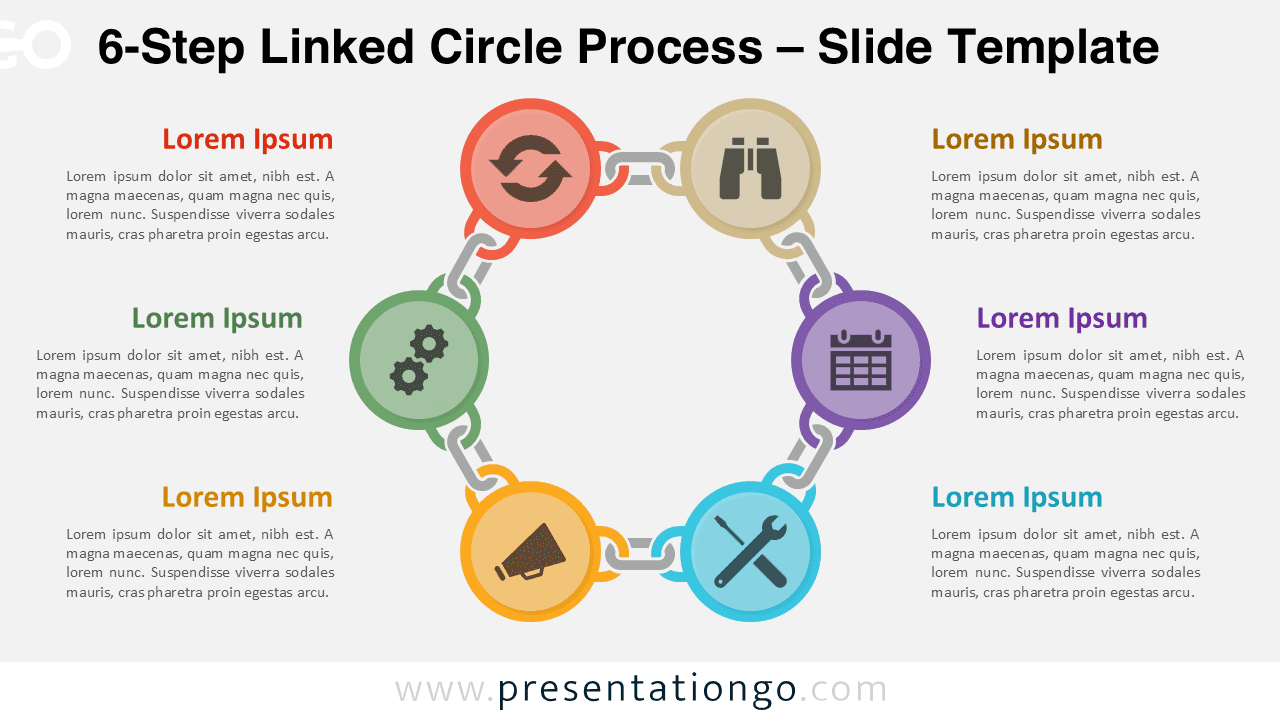
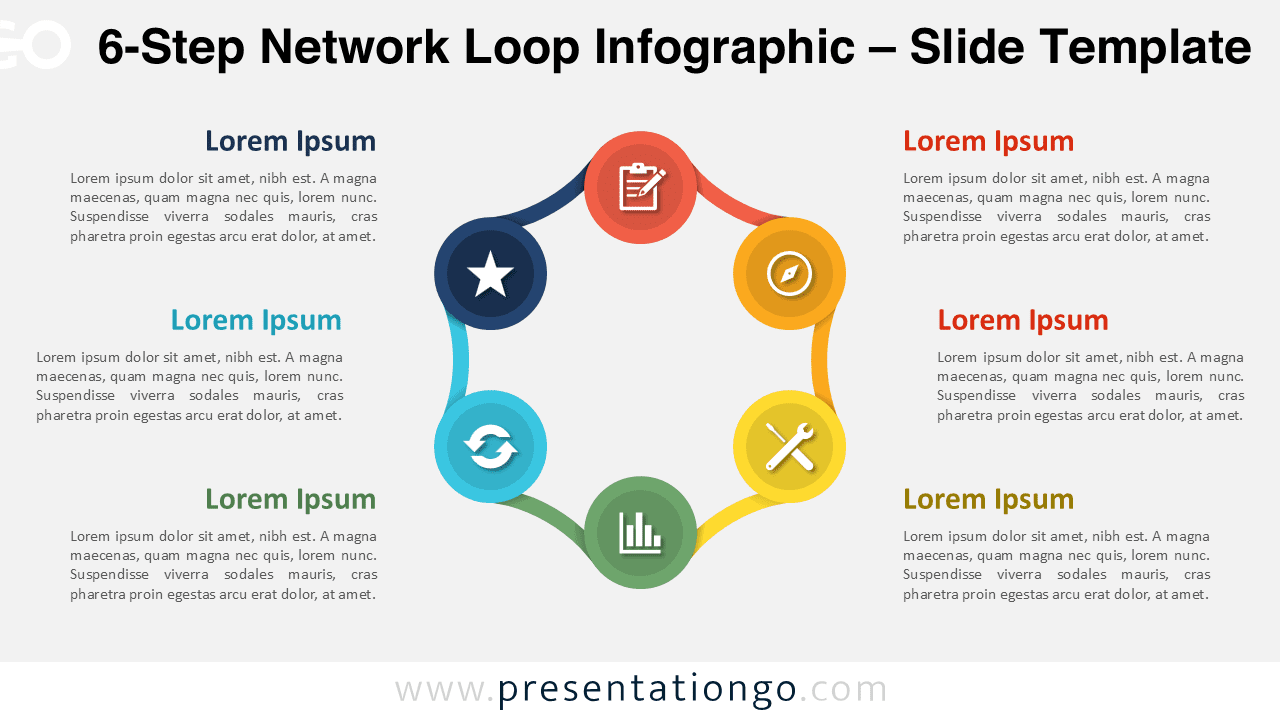
A six-step linked circle diagram for PowerPoint and Google Slides. Use it for complex workflows and strategies.
Google Slides, PPTX
16:9
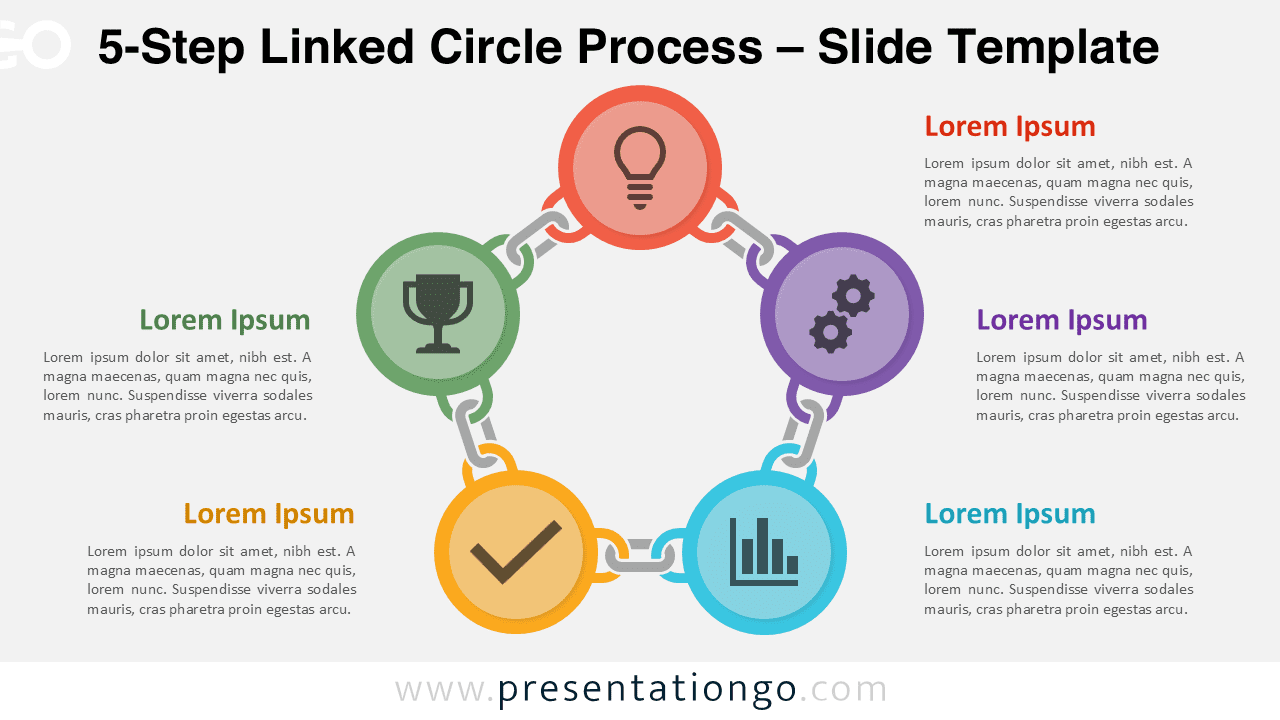
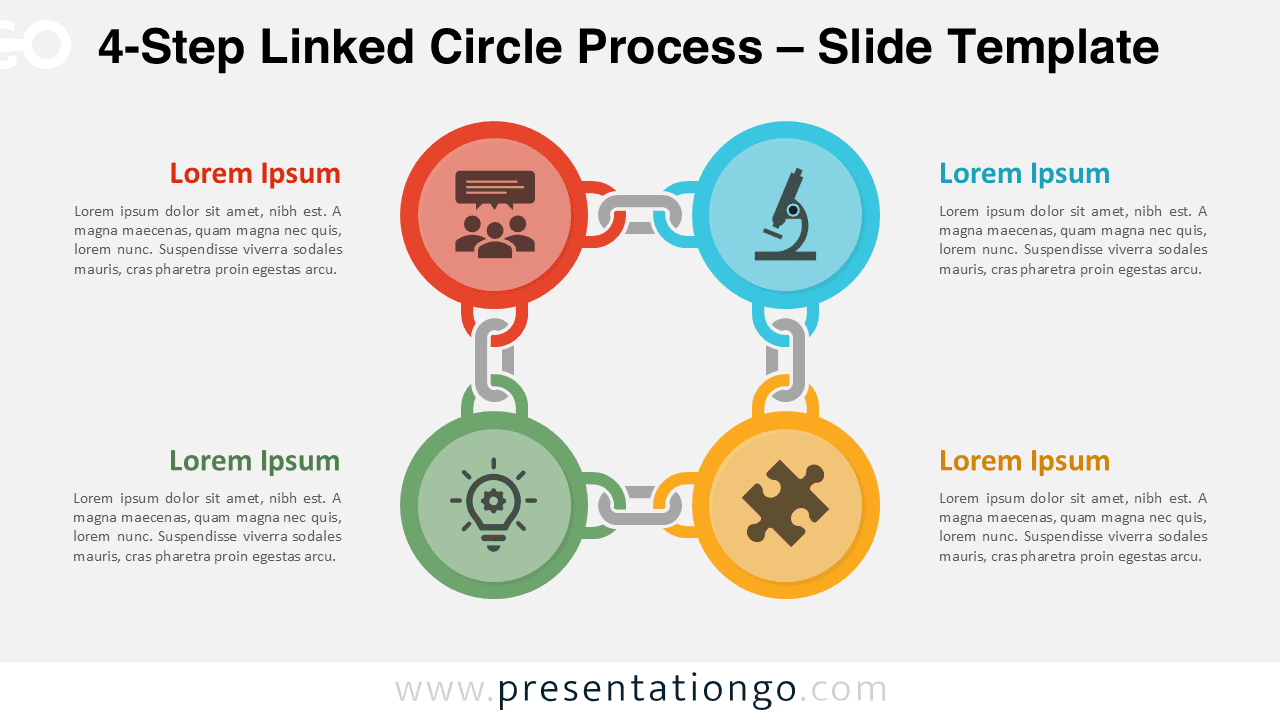
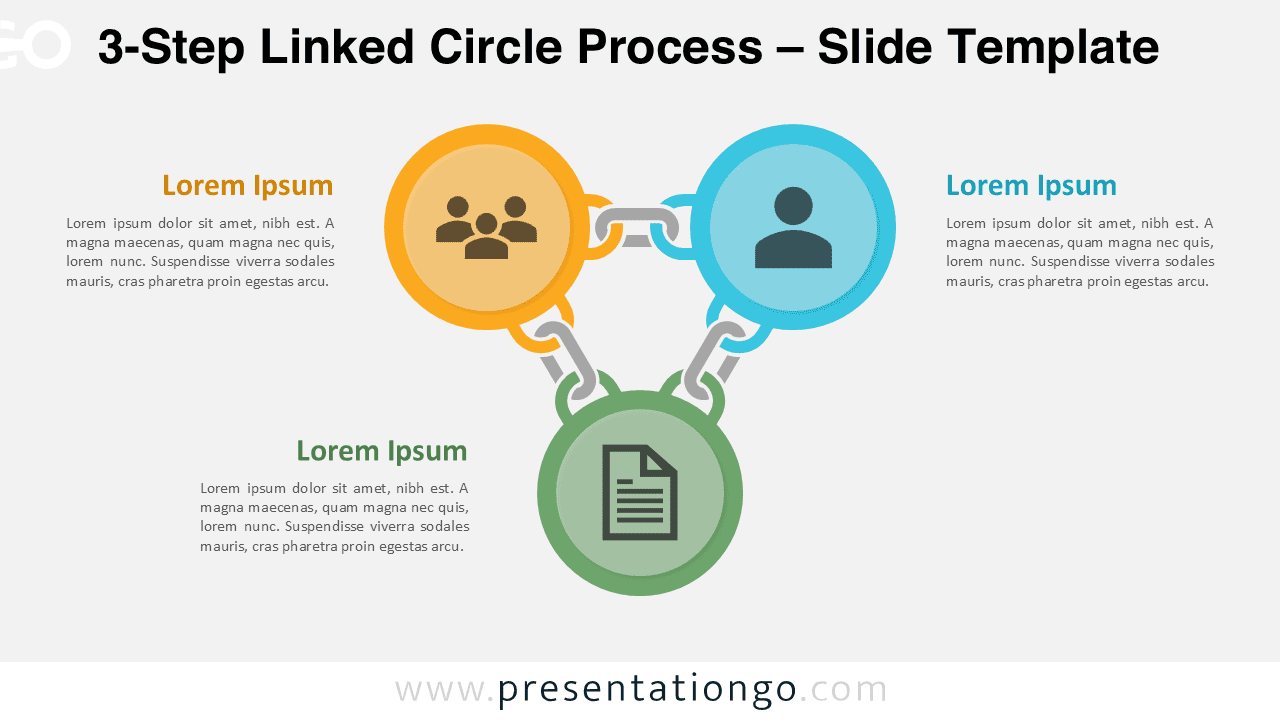
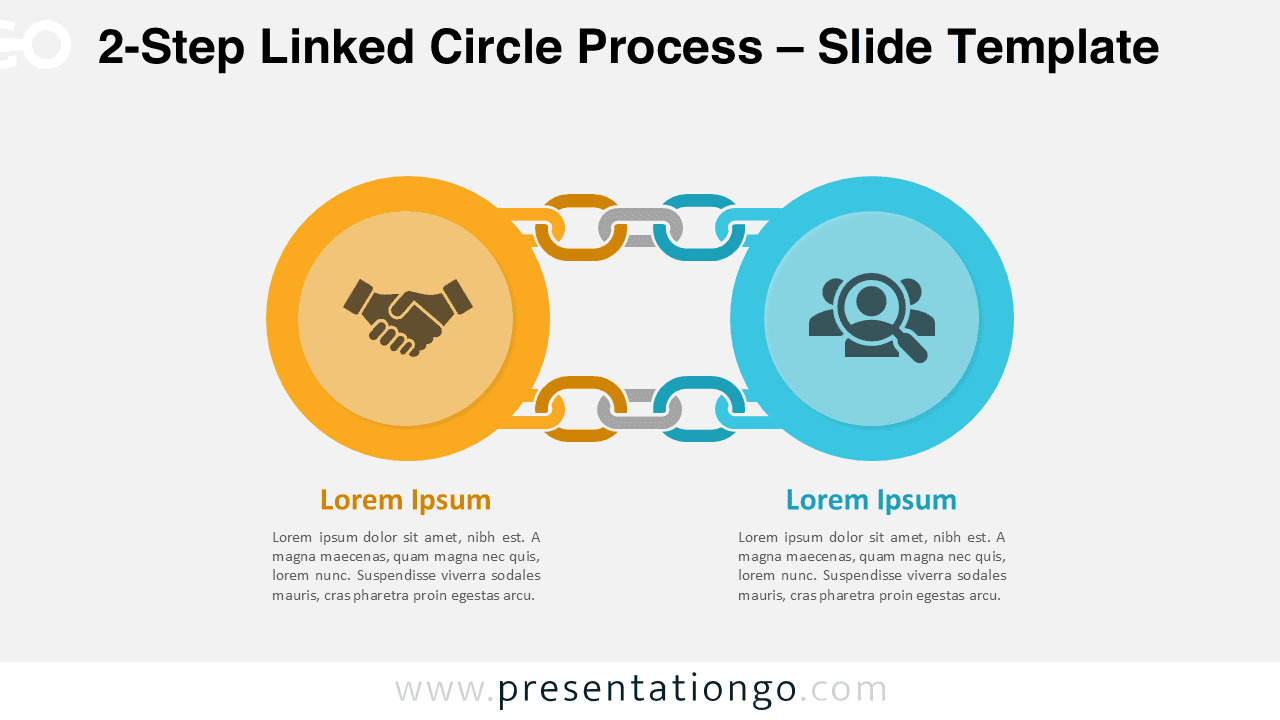
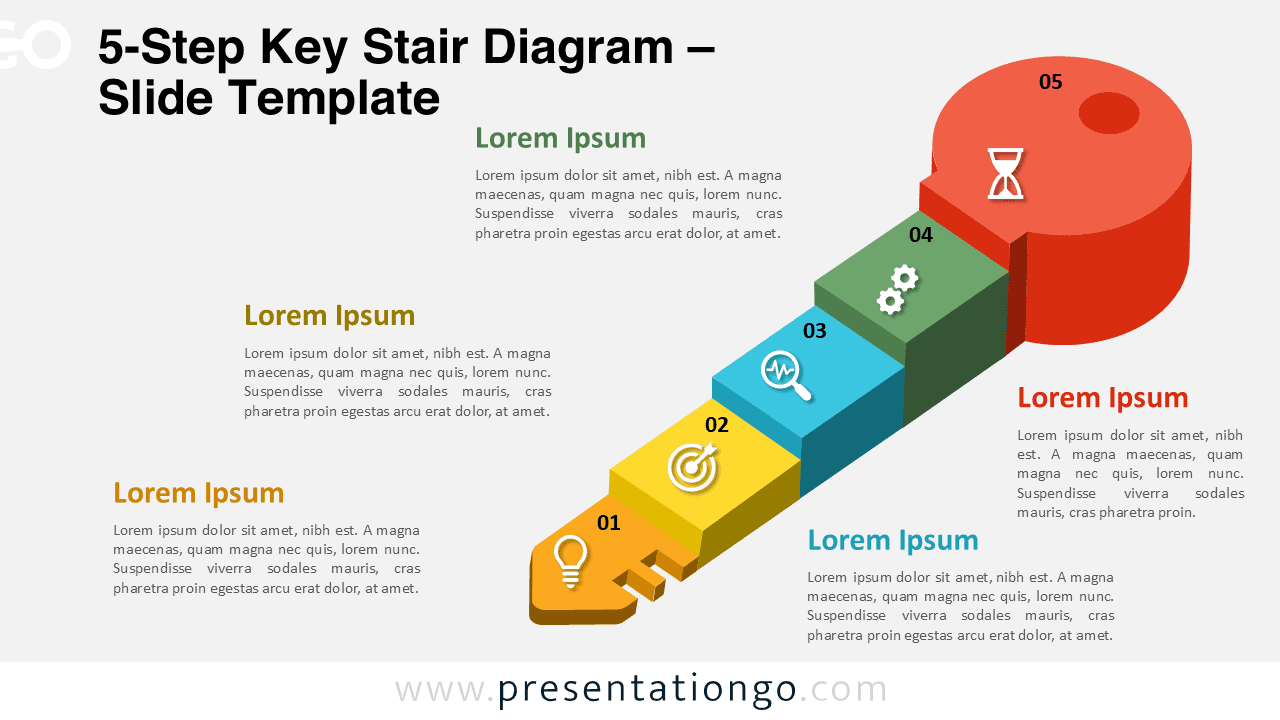
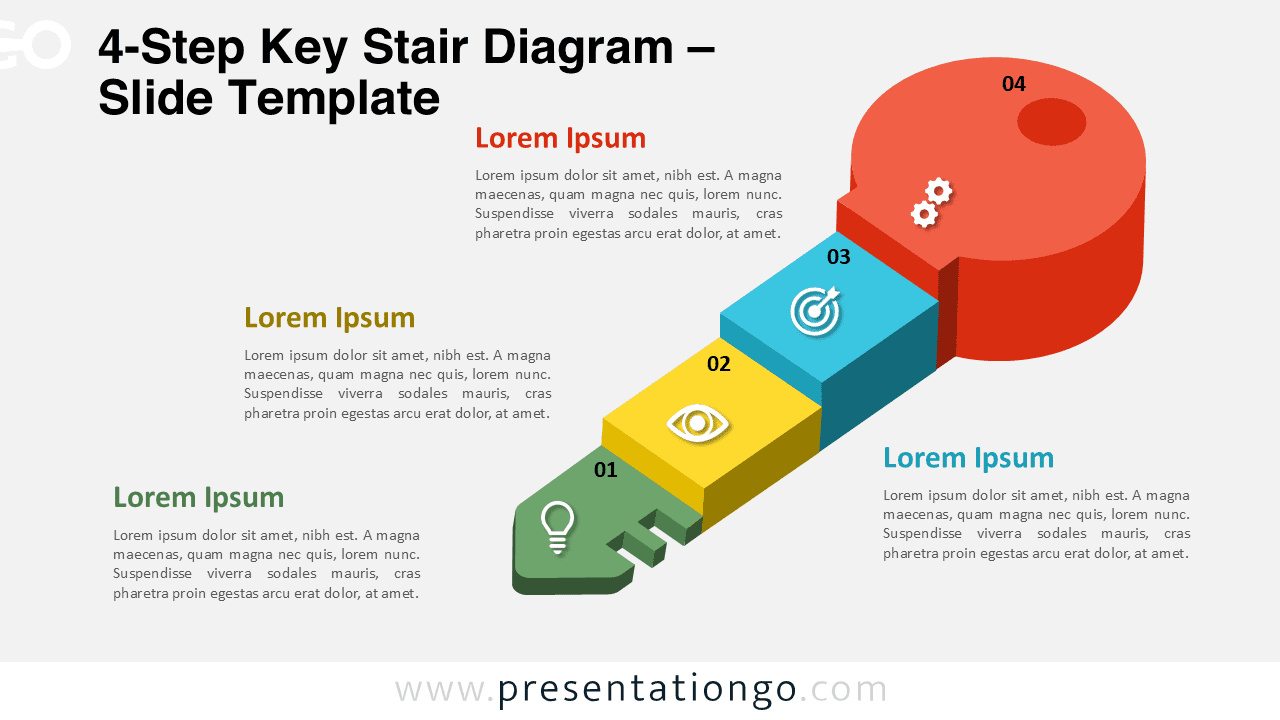
All these diagrams for Google Slides and PowerPoint contain visual elements to illustrate connections. They show how you pass from one step to the next in a process, task, or workflow.
Google Slides, PPTX
16:9
Google Slides, PPTX
16:9
Google Slides, PPTX
16:9
Google Slides, PPTX
16:9
Google Slides, PPTX
16:9

JPG
Square

JPG
4:3

JPG
Square
Google Slides, PPTX
16:9
Google Slides, PPTX
16:9
Google Slides, PPTX
16:9
Google Slides, PPTX
16:9
