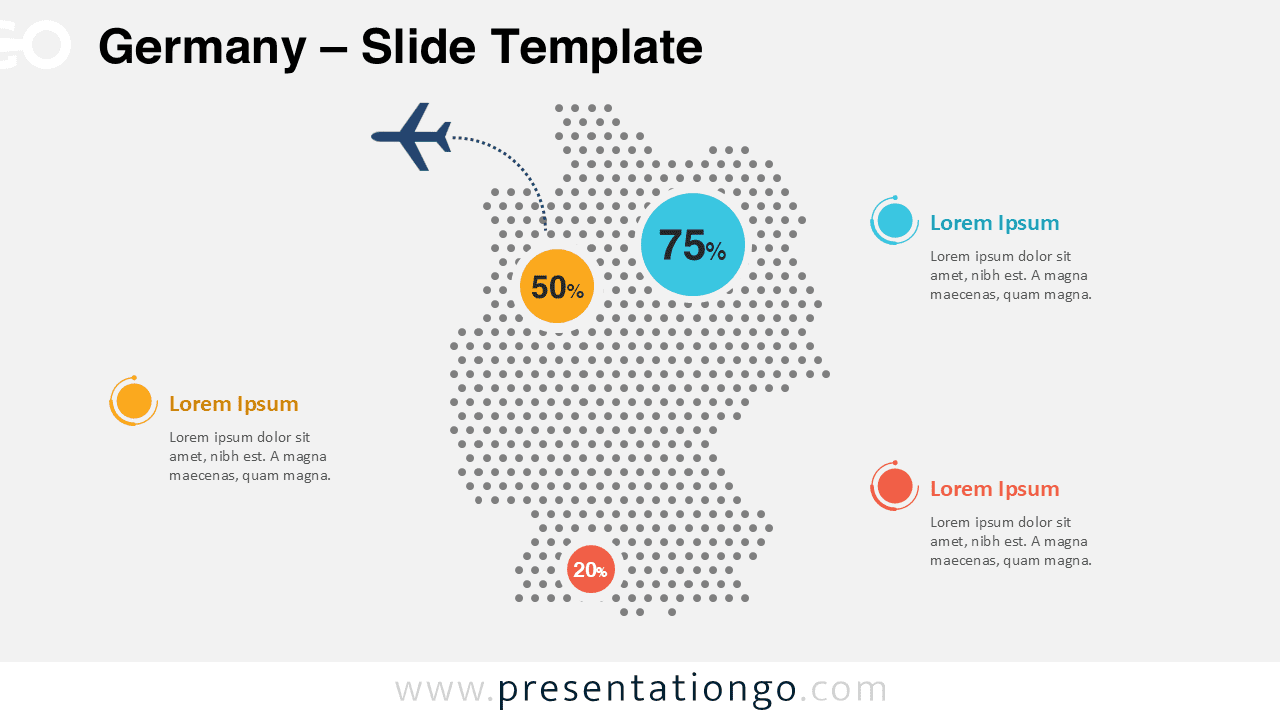
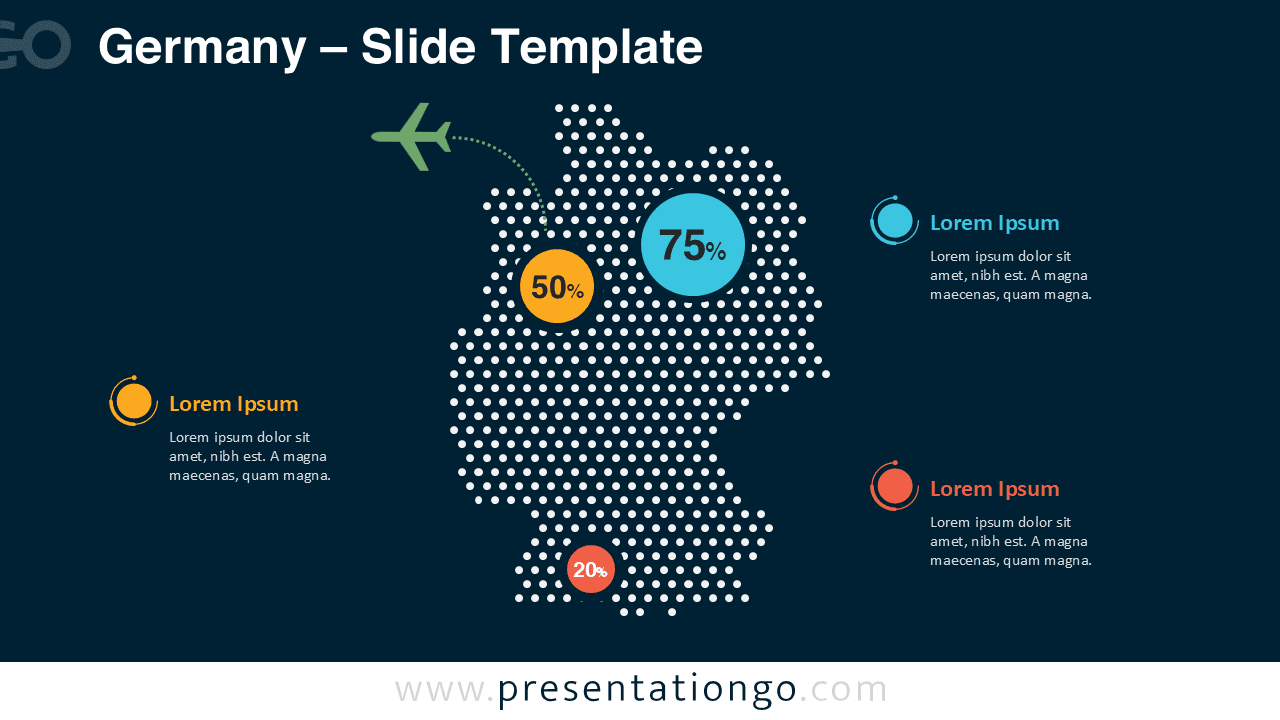
The Germany Dotted Map Infographic provides a clear and modern way to present geographic data in PowerPoint and Google Slides presentations. Built using a dotted pattern that forms the recognizable shape of Germany, this infographic helps you highlight regional insights, statistics, and business information with visual clarity.
Instead of displaying data through traditional charts alone, this infographic allows you to anchor information directly on the map. Percentage markers and explanatory text blocks make it easy to emphasize key locations and regional differences. As a result, audiences quickly understand geographic patterns and data distribution.
Map Preview
Features and Customization Options
- Editable Germany dotted map layout
- Two slide versions included for different presentation themes
- Customizable data markers and percentage indicators
- Fully editable text placeholders for annotations
- Simple color adjustments to match branding
- Compatible with both PowerPoint and Google Slides
Design and Structure
The infographic centers on a dotted silhouette of Germany, built from evenly spaced circular points that create a clean and modern visual effect. This approach keeps the map recognizable while maintaining a minimalist design that works well in professional presentations.
Data markers positioned on different regions allow presenters to highlight important statistics or business metrics. Each marker connects visually to surrounding text blocks that provide additional explanation. This structure creates a logical storytelling flow between the map and the supporting information.
Two slide versions are included. The light version offers a neutral background suitable for corporate or academic presentations. The dark version provides a stronger visual contrast that works well for modern presentation styles and digital screens.
Practical Applications
- Market analysis across German regions
- Business expansion or regional performance reports
- Travel and tourism statistics
- Logistics and transportation presentations
- Demographic and population analysis
- Geographic data visualization
Summary
The Germany Dotted Map Infographic helps presenters communicate geographic information in a clear and visually engaging format. With its modern dotted design, editable data markers, and compatibility with PowerPoint and Google Slides, it becomes a versatile tool for business, education, and data storytelling.