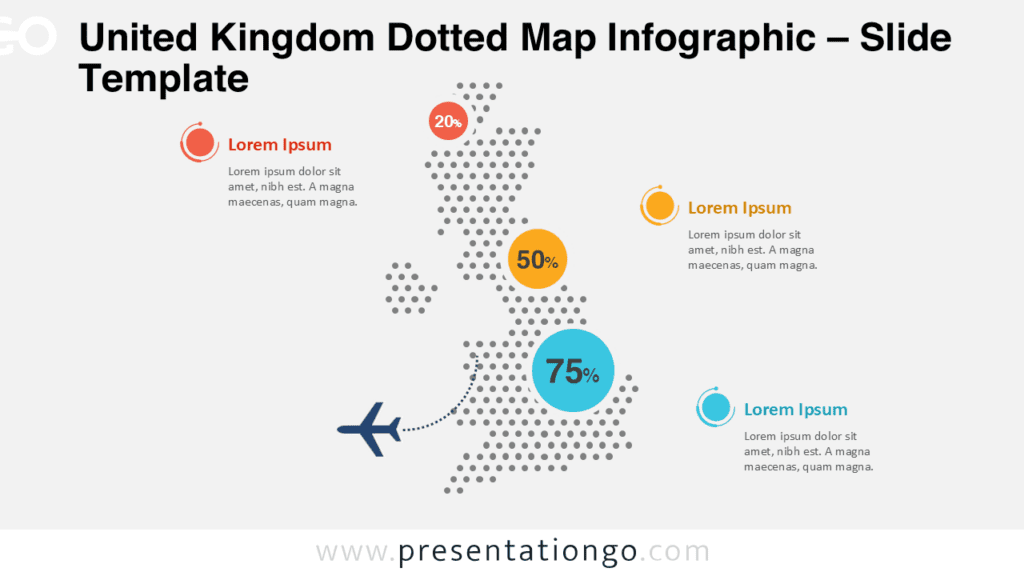
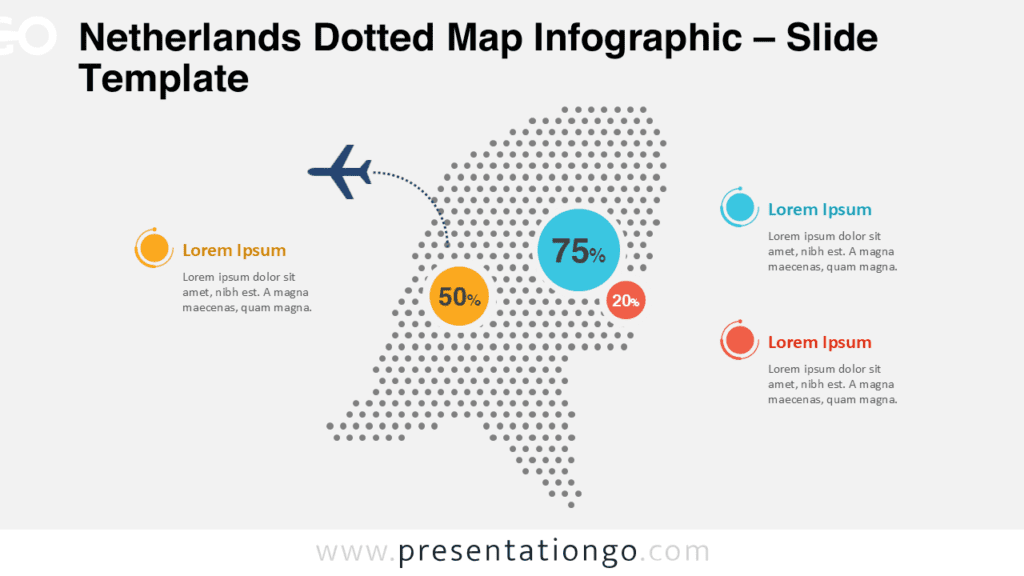
The Switzerland Dotted Map Infographic offers a clear and visually engaging way to present geographic information in PowerPoint and Google Slides. This map uses a modern dotted pattern to form the outline of Switzerland, making it ideal for highlighting regional insights, statistics, and business data.
Instead of using a traditional map style, this design focuses on simplicity and readability. The dotted layout keeps the map clean while allowing you to place markers, percentages, or labels directly on the regions you want to emphasize.
Map Preview
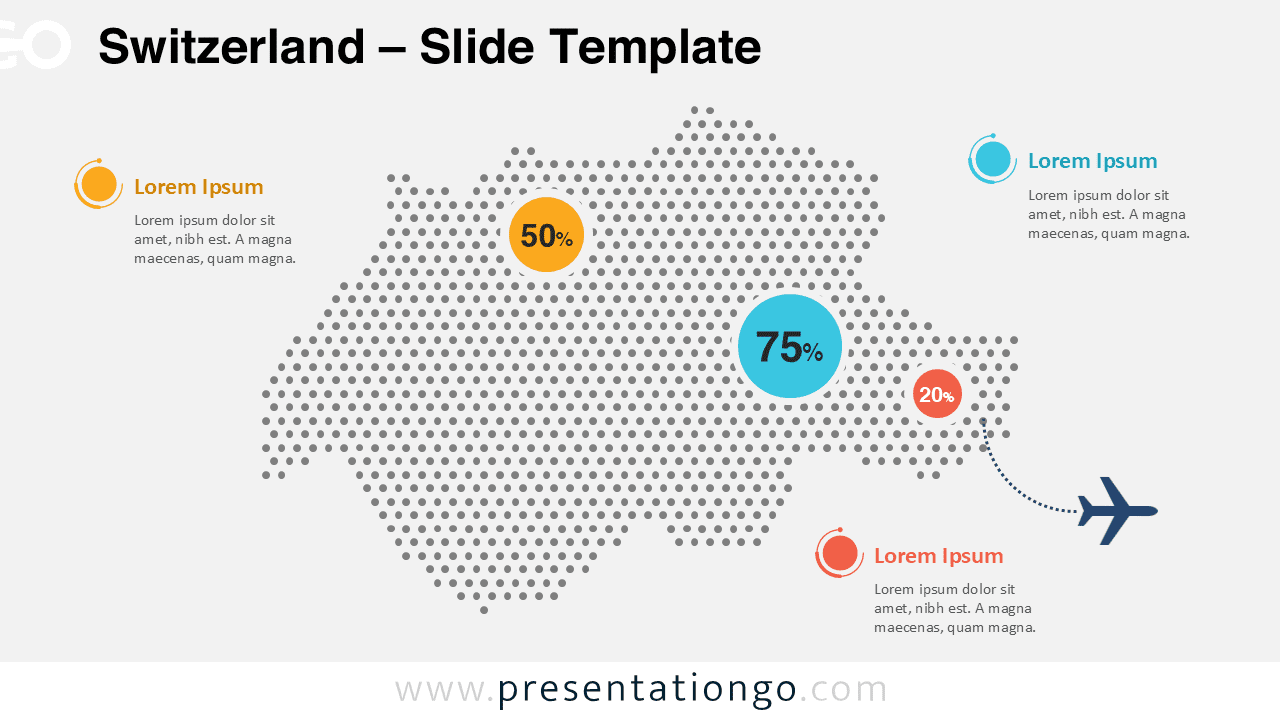
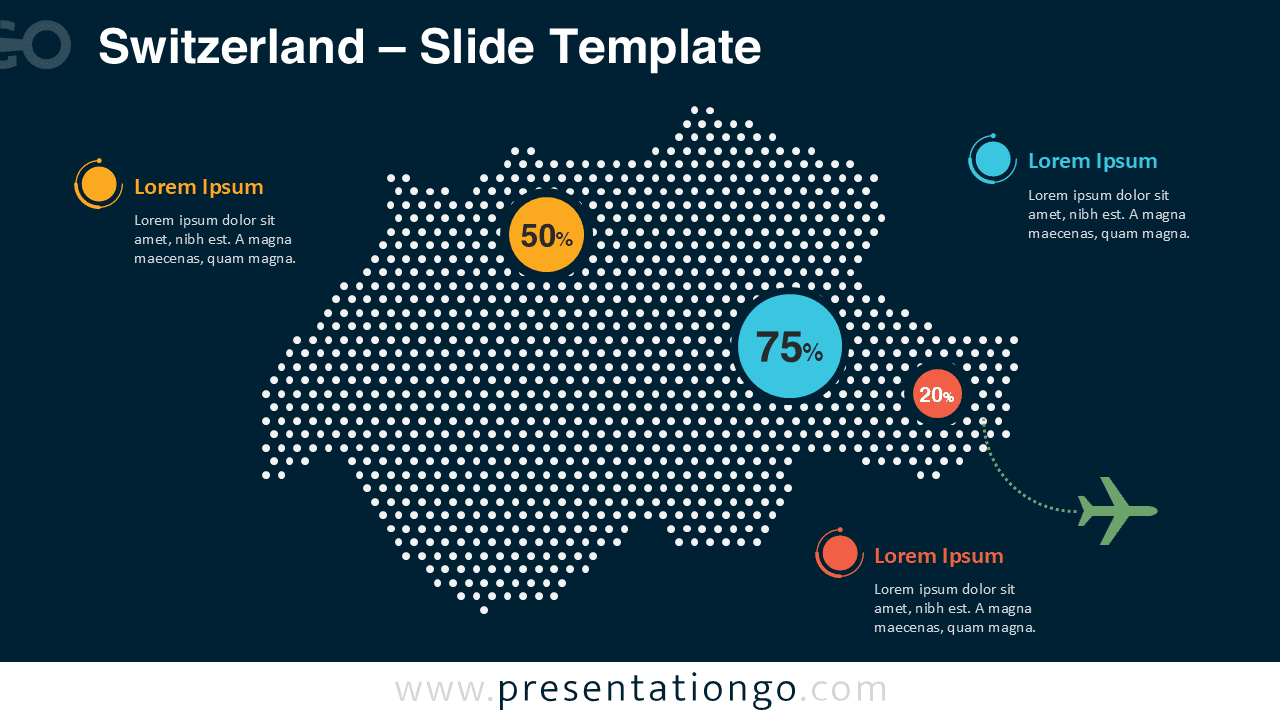
The infographic includes both light and dark slide versions so you can easily adapt the design to different presentation themes. Whether you are preparing a business report, market analysis, or tourism presentation, the map helps communicate geographic insights quickly.
Features and Customization Options
- Editable dotted map of Switzerland
- Two slide versions included for light and dark presentations
- Customizable data markers and percentage indicators
- Easy-to-edit text placeholders
- Fully compatible with PowerPoint and Google Slides
- Vector shapes that allow color and size adjustments
Design and Structure
The map is constructed using evenly spaced dots that create the recognizable shape of Switzerland. This style gives the design a modern infographic appearance while maintaining geographic clarity. Colored circular markers are used to highlight important statistics or data points across different areas.
Additional elements such as dotted connection lines and icons help link specific locations on the map to explanatory text. These visual cues make it easier for your audience to understand the story behind the data.
Practical Applications
- Regional sales or performance analysis
- Market expansion presentations
- Tourism and travel reports
- Economic or demographic studies
- Logistics and transportation planning
- Business or government reporting
Summary
The Switzerland Dotted Map Infographic helps presenters transform geographic data into clear visual stories. With editable markers, customizable colors, and compatibility with both PowerPoint and Google Slides, this infographic offers a practical solution for presenting Swiss regional insights in a modern and professional way.