The Mexico Insights Map helps you present regional information about Mexico with clarity. Use it to show territories, priorities, opportunities, and insights in PowerPoint and Google Slides.
Slide Template Preview


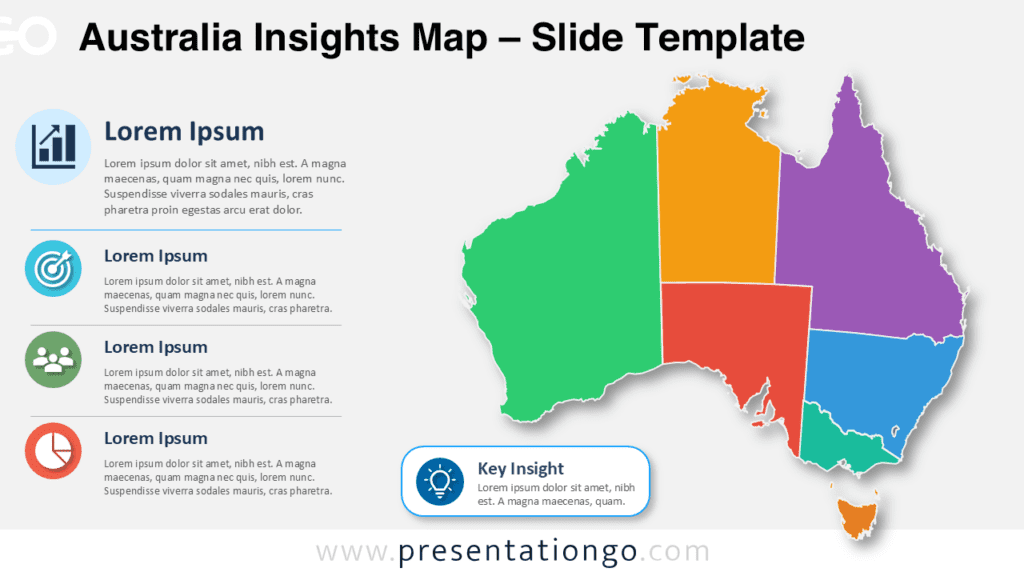
This diagram works well when you need a country view and a clear explanation panel on one slide. It gives every section a defined role. The map attracts attention, while the supporting notes guide the discussion.
Features and Customization Options
The Mexico Insights Map includes editable elements that help you adapt the diagram quickly for business reports, regional analysis, and presentation storytelling. You can update the content, adjust the structure, and tailor the slide to your message in PowerPoint or Google Slides.
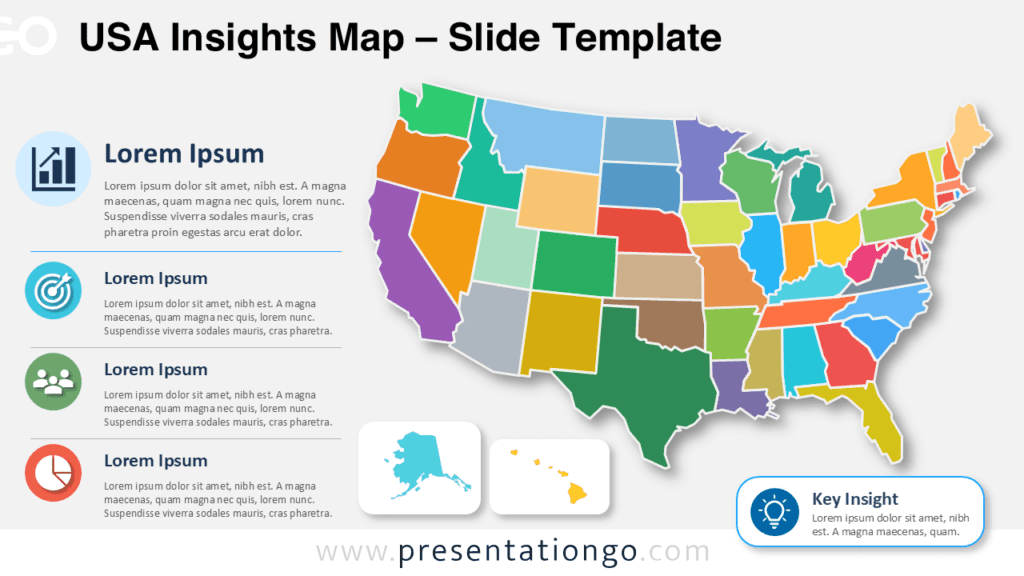
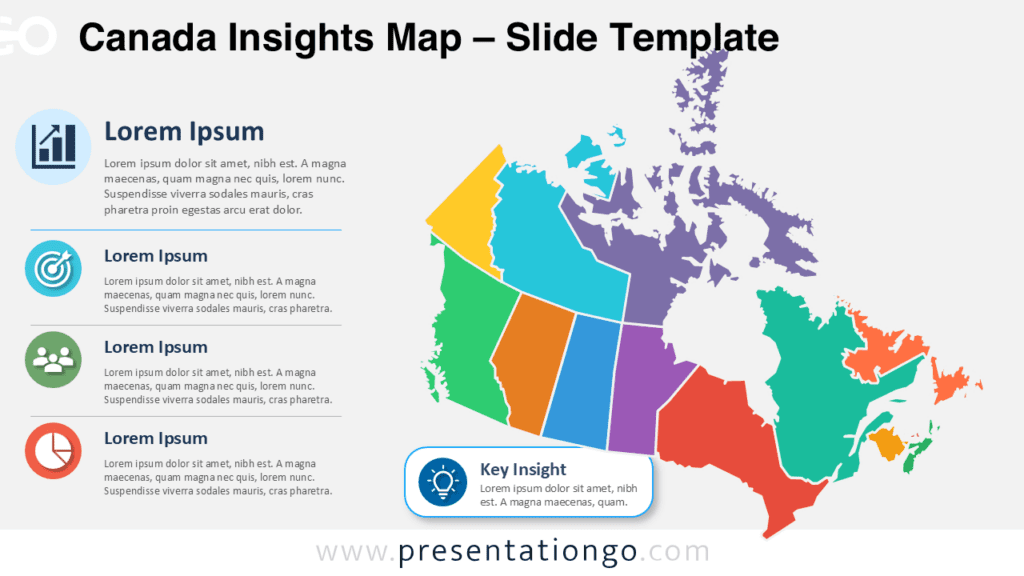
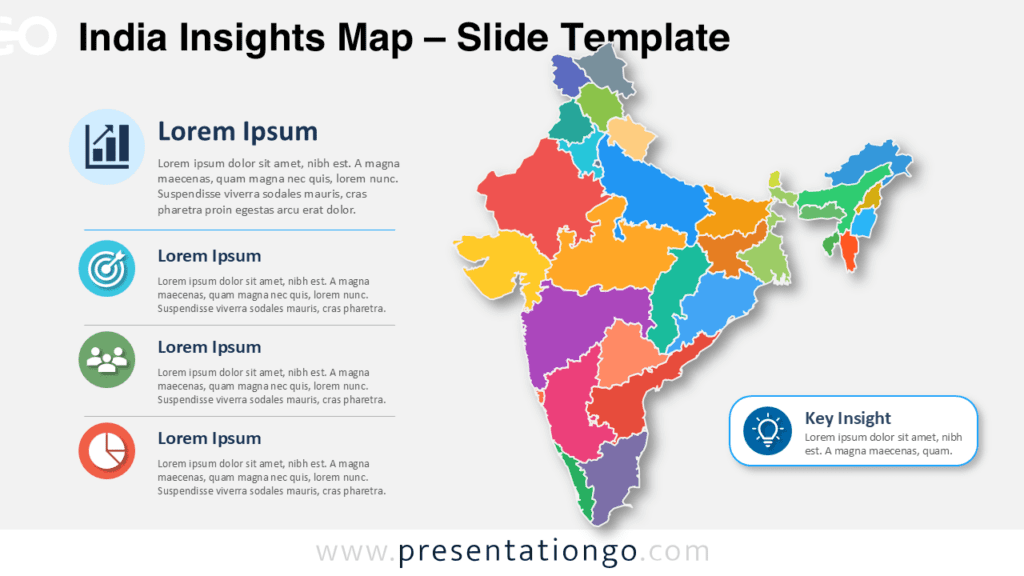
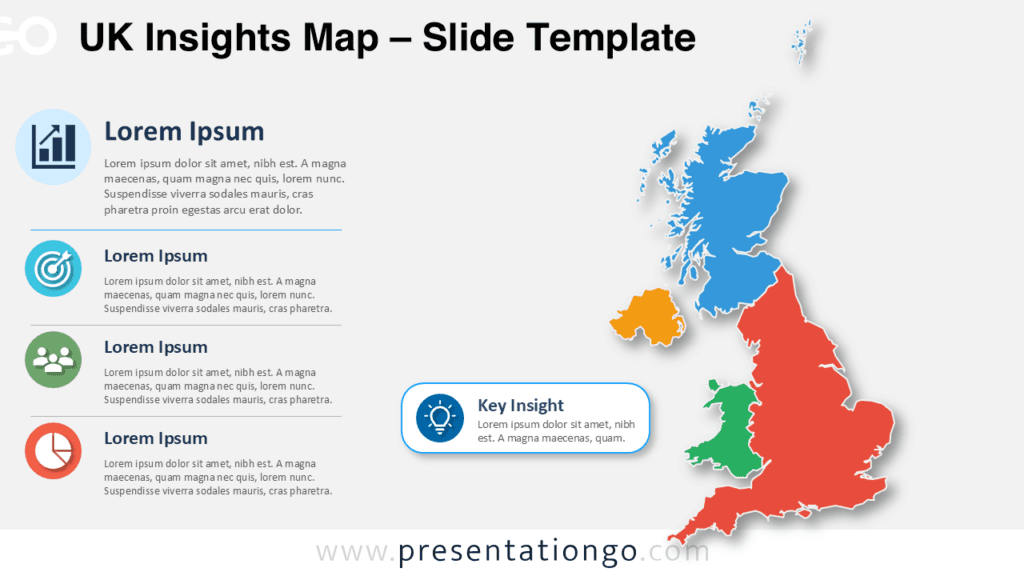
- Editable Mexico map with separate regional shapes.
- Four insight blocks for key data points, findings, or recommendations.
- Dedicated key insight callout to highlight one important takeaway.
- Text placeholders that you can replace with your own headings and descriptions.
- Icons from the Office icon library, making them easy to modify, replace, resize, or recolor.
- Flexible layout that works for reports, executive summaries, workshops, and client presentations.
This structure makes the Mexico Insights Map easy to customize for different audiences. You can keep the full layout, remove sections, replace icons, or focus only on the map when you need a cleaner geographic visual.
Design and Structure
The composition gives the map a strong visual role. The left column organizes supporting points into four short content areas. The right callout highlights one main takeaway. This structure helps audiences scan regional data before reading details. It also keeps the slide balanced for meetings, reports, workshops, and executive summaries.
Practical Applications
You can use this Mexico Insights Map for market analysis, regional performance updates, sales territory reviews, logistics planning, and tourism reports. It also supports policy summaries, educational content, demographic comparisons, and client presentations.
- Present regional business performance across Mexican states.
- Compare market opportunities by territory.
- Summarize sales, logistics, tourism, or demographic insights.
- Build country-focused reports for clients, teams, or stakeholders.
- Explain policy, education, or economic indicators by region.
Consultants can use it to compare market presence across regions. Sales teams can show territory priorities during quarterly reviews. Public organizations can summarize programs, coverage, or regional challenges. Educators can introduce Mexico through a visual and structured slide.
Summary
The Mexico Insights Map gives presenters a clear way to turn geographic information into an engaging slide. It supports regional analysis without forcing audiences through dense tables. You can adapt each text area, map segment, icon, and callout to your message. Use it when you need a polished Mexico map diagram for PowerPoint and Google Slides.