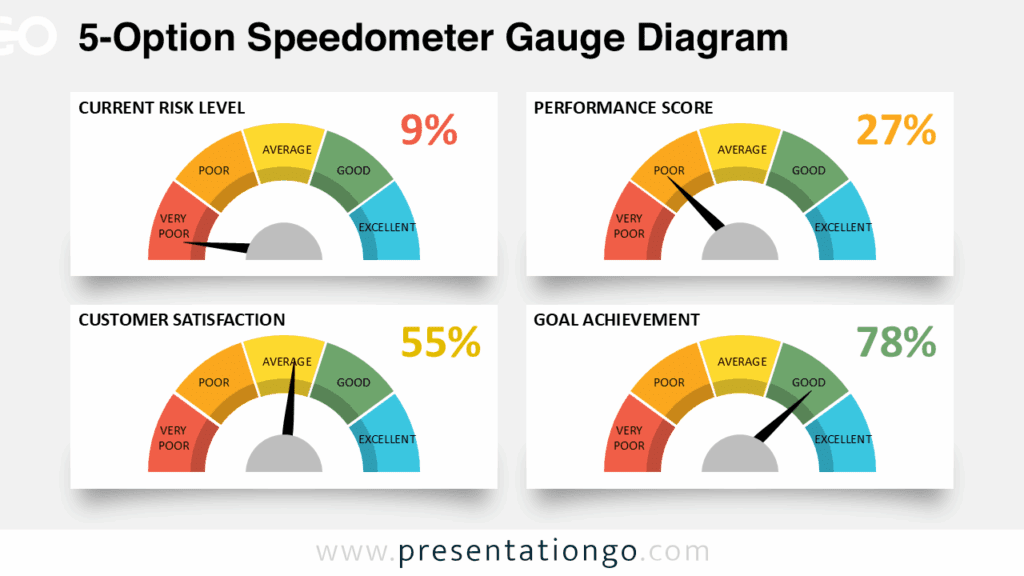
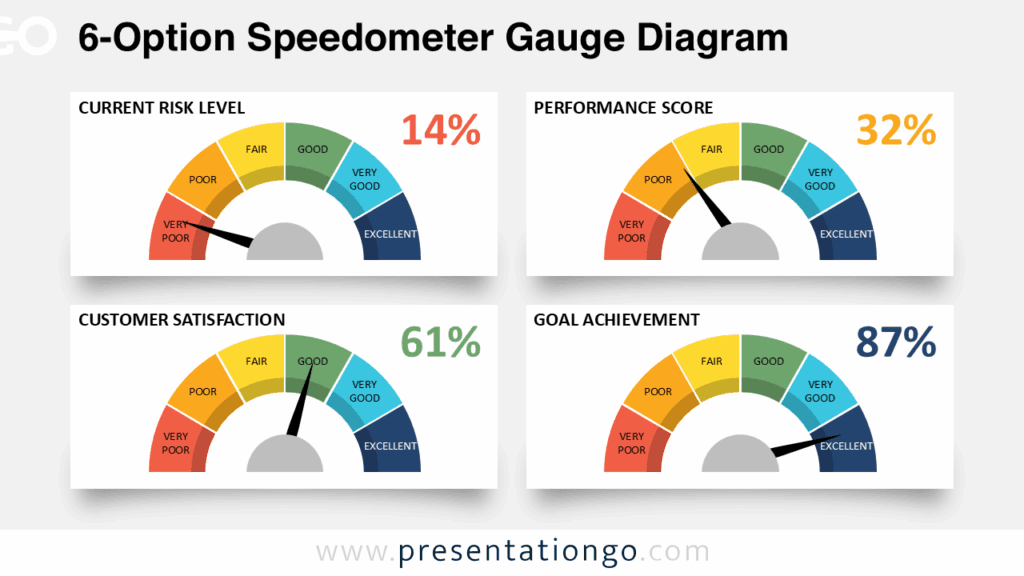
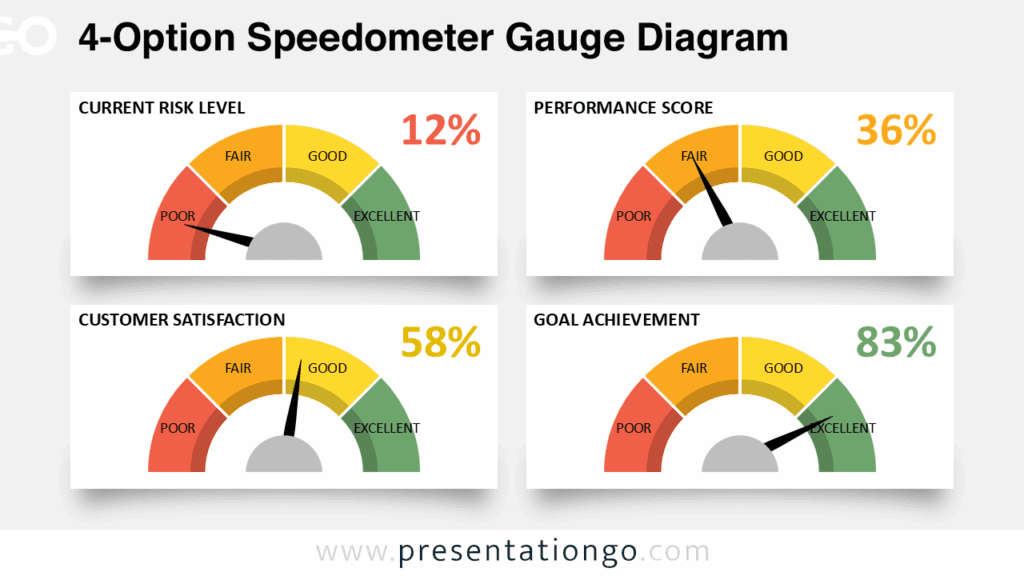
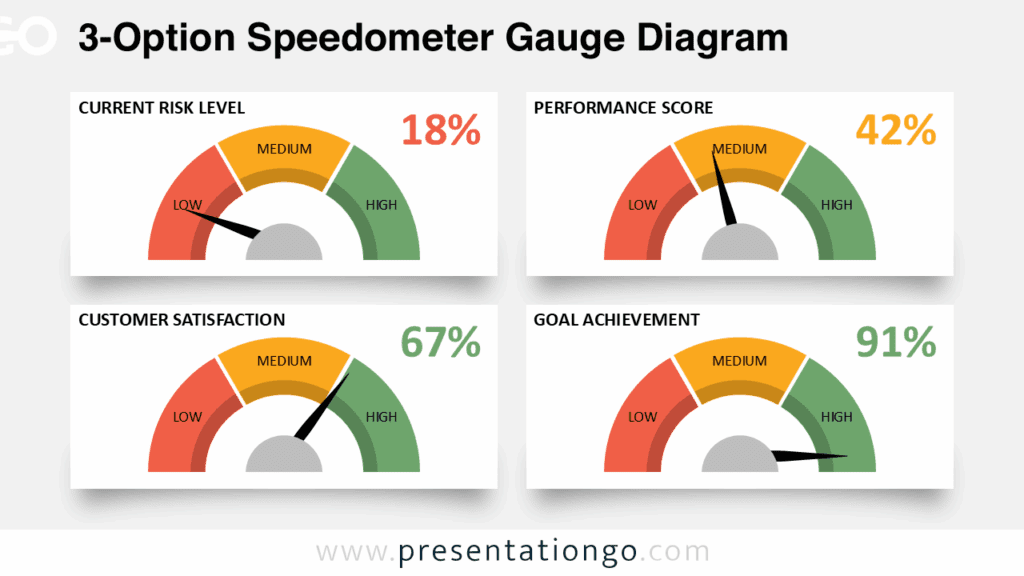
The Performance Rating Gauge gives you a clear way to communicate levels, scores, and evaluations in a presentation. Its large semicircular gauge immediately draws attention to the current rating. Five defined stages run from very low to very high, while a central needle reinforces the selected position. Supporting text areas and labeled status cards help you add context without making the slide feel crowded.
This diagram works well when a simple number does not tell the whole story. You can use the Performance Rating Gauge to show performance, progress, risk, satisfaction, readiness, maturity, or achievement. The layout keeps the main result visible while leaving enough room for explanations and supporting information.
Diagram Preview
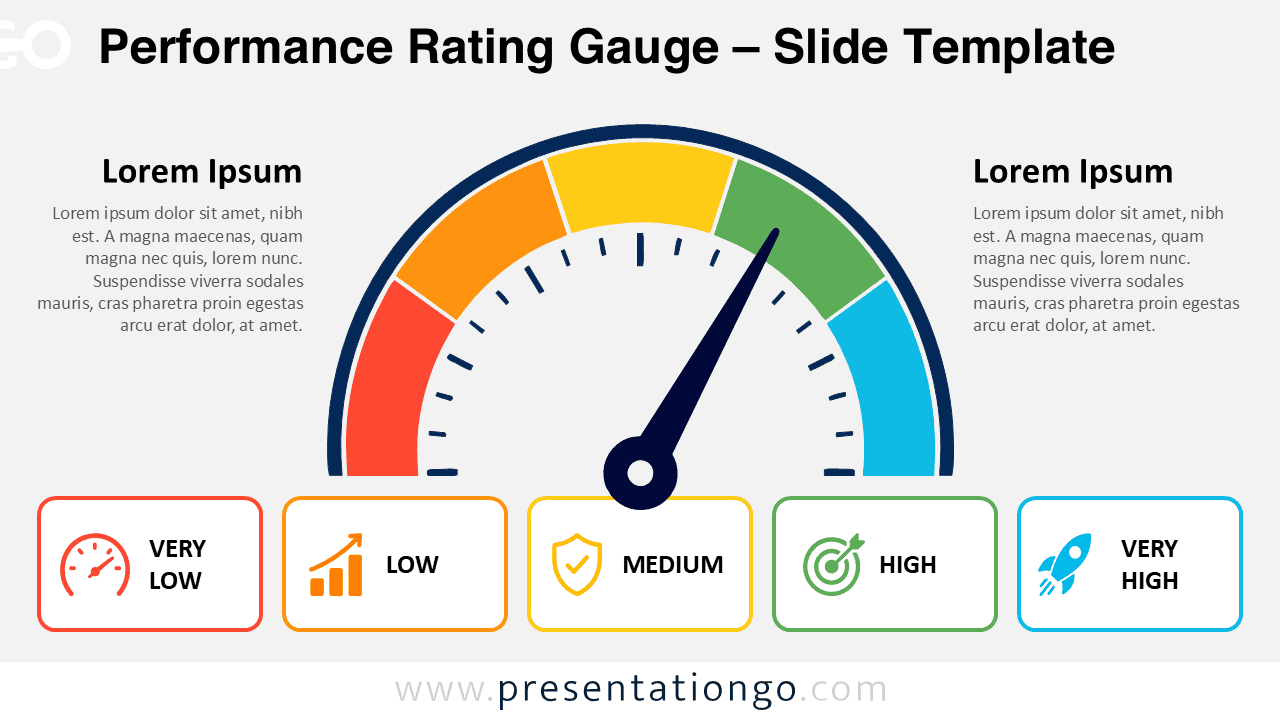
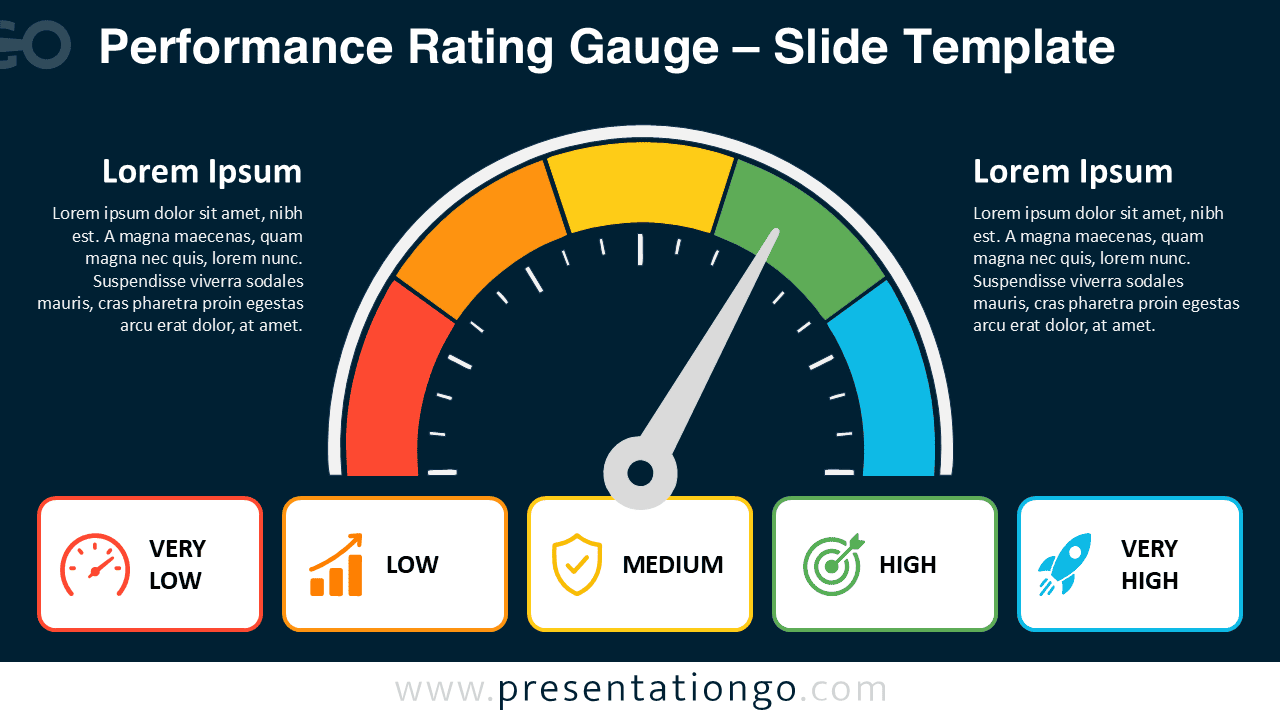
The Performance Rating Gauge is supplied in two coordinated slide versions for PowerPoint and Google Slides. Both versions use the same structure, so you can choose the one that best fits your presentation. Every major element remains editable, including the gauge, needle, labels, text, shapes, and supporting cards.
Features and Customization Options
- Compatible with Microsoft PowerPoint and Google Slides
- 2 slides across light and dark versions
- Editable text, shapes, sizes, and icon placeholders
- Five-level rating gauge, fully editable
- Icons are easily modifiable, recolorable, resizable, or replaceable
- Includes both light and dark background versions
Design and Structure
The slide centers on a large five-stage gauge with an adjustable needle. This structure creates a natural reading order from the overall result to the supporting details. Five status cards below the gauge repeat each rating level, making the scale easy to scan during a presentation.
Two text areas sit beside the central visual and provide space for explanations, observations, or recommendations. The balanced composition works especially well for executive updates and analytical presentations. You can also modify the labels to build your own rating scale, scoring system, or assessment framework.
Practical Applications
- Rate overall business or team performance
- Present KPI status during management reviews
- Show project health or completion levels
- Communicate risk and readiness assessments
- Visualize customer satisfaction ratings
- Compare maturity or capability levels
- Summarize quality and compliance evaluations
- Highlight progress toward strategic objectives
Summary
The Performance Rating Gauge turns an evaluation into a visual that audiences can understand quickly. Its five-level structure supports many scoring and assessment scenarios without forcing you into one specific business model. The accompanying status cards and text areas also provide room for the details behind the rating.
Because the diagram is editable in PowerPoint and Google Slides, you can adapt the wording, scale, icons, shapes, and needle position to your message. Use it for dashboards, reports, reviews, assessments, or any presentation that needs a clear visual rating.