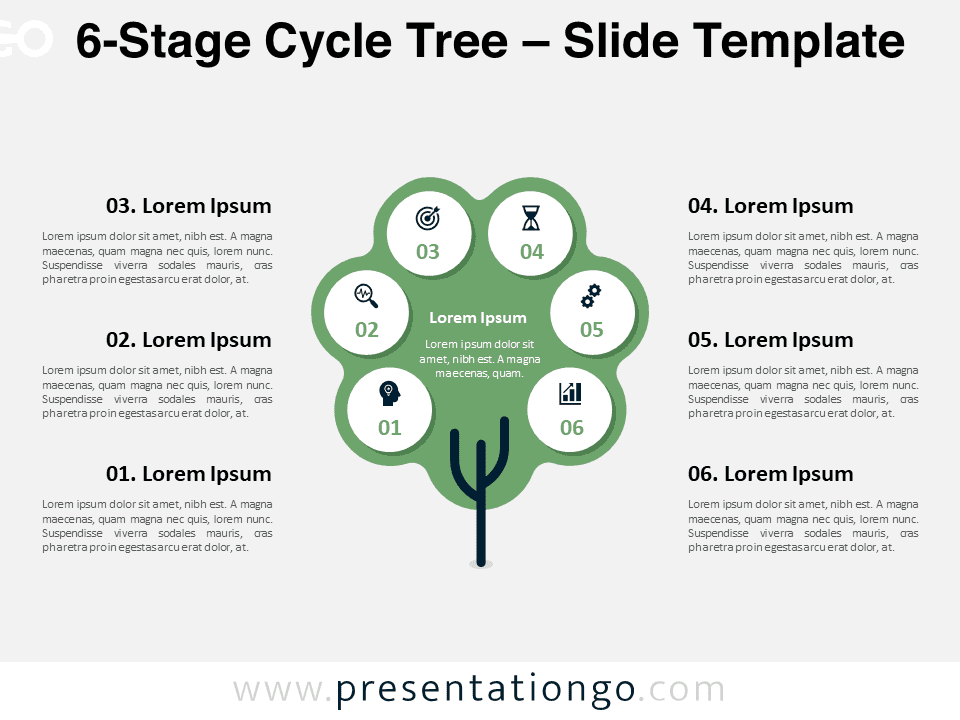
The 6-Stage Cycle Tree seamlessly integrates with PowerPoint and Google Slides, offering a circular flow diagram with six distinct steps, perfect for illustrating processes and sequences.
Tree-Inspired Cycle Graph for Presenting 6 Phases
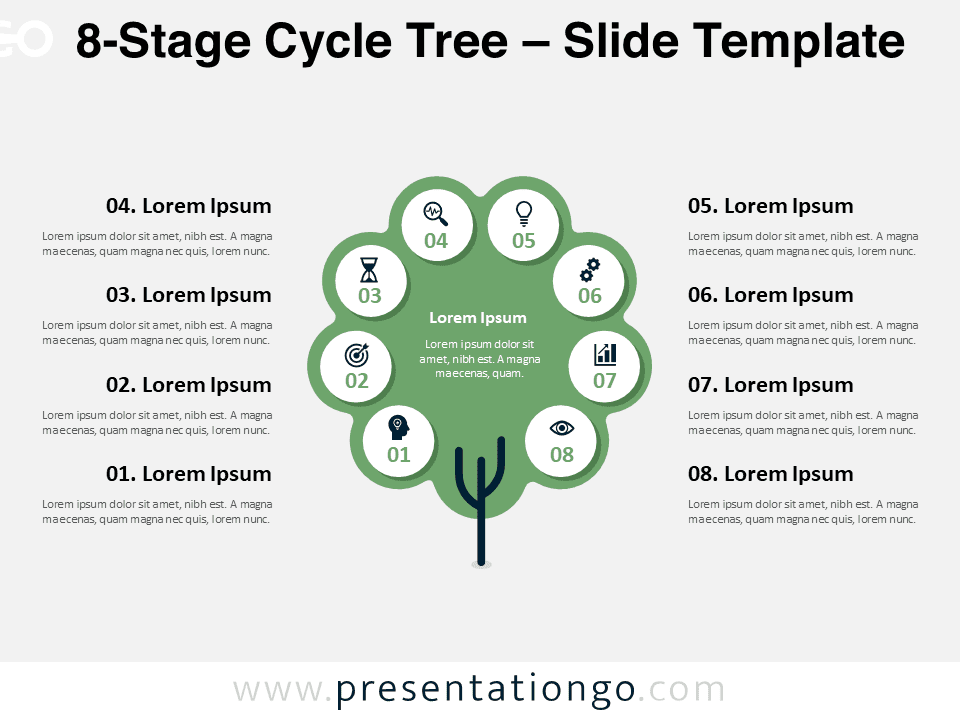
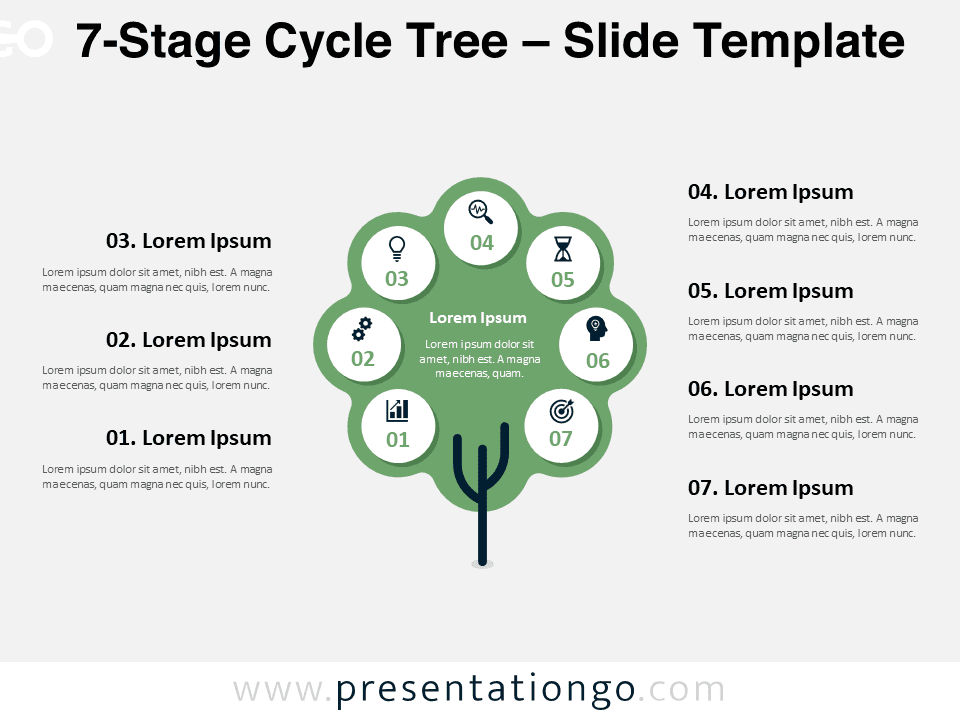
Cycle diagrams effectively represent processes or sequences in a continuous loop, facilitating the understanding of complex systems. Our 6-Stage Cycle Tree template stands out with its stylized, flat-design tree at the center, connecting three branches to a circular flow of six numbered nodes. Each node houses an icon within a smaller circle, visually defining each stage, accompanied by text placeholders for detailed descriptions. This design ensures clarity and a professional appeal suitable for various contexts.
This versatile template caters to professionals needing to depict cycles such as project phases, business operations, or product life cycles. For instance, it suits business models like Tuckman’s team development stages or marketing mix elements. The template simplifies conveying concepts like continuous improvement cycles or workflow sequences, making it invaluable for presentations aimed at strategic planning and process visualization.
The presentation document features two unique slides, pre-populated with icons, numbers, and text placeholders. Its fully customizable shapes allow complete control over the presentation’s look, available in both light and dark themes and in Standard (4:3) and Widescreen (16:9) ratios for PowerPoint and Google Slides. Users can tailor the template to their specific needs, ensuring their presentations precisely reflect their message.
Widescreen (16:9) size preview:
This ‘6-Stage Cycle Tree’ template offers:
- 2 unique slides
- Options for both light and dark themes
- Pre-populated with icons, numbers, and text placeholders
- Fully customizable shapes for complete control
- Available in both Standard (4:3) and Widescreen (16:9) ratios
- Offered in both PowerPoint PPTX and Google Slides formats


