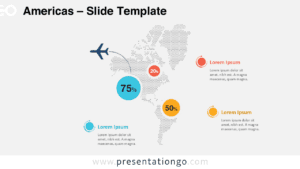
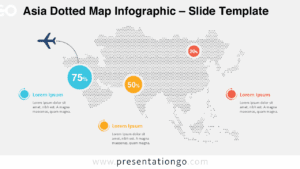
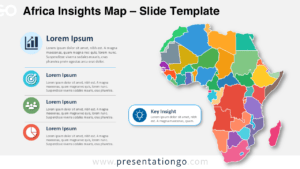
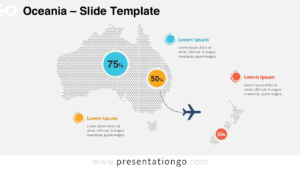
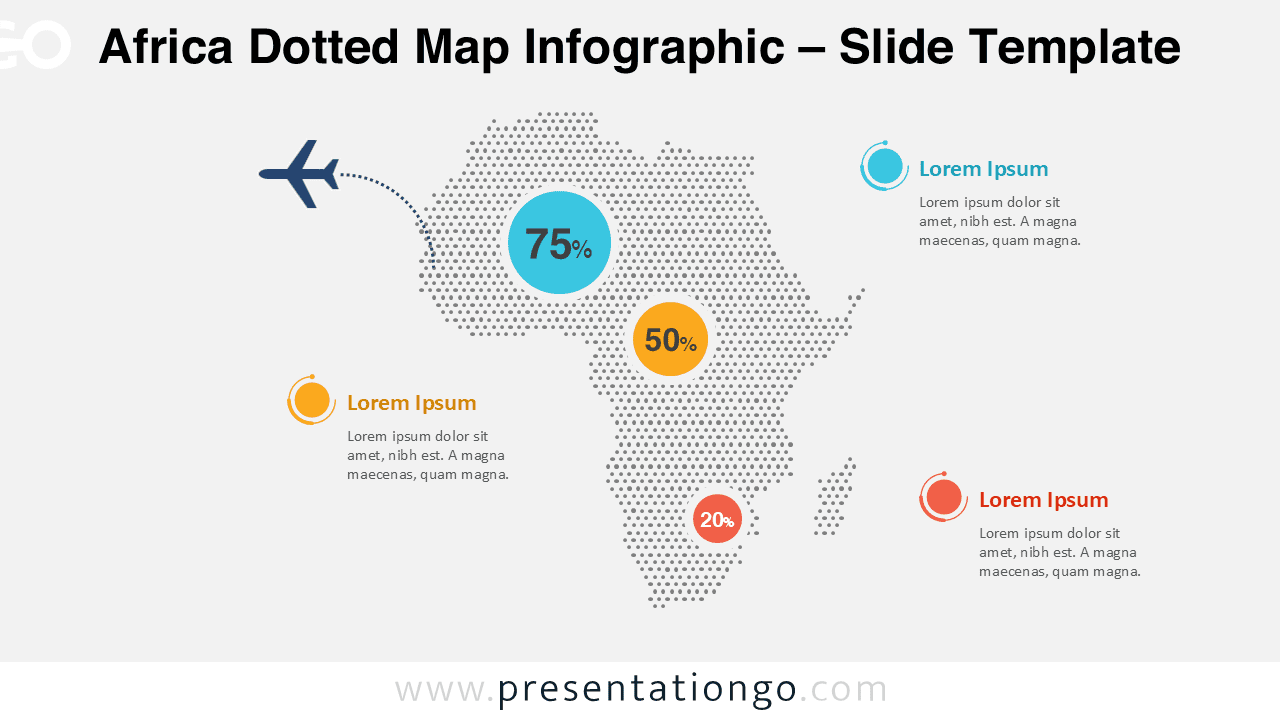
Create clear geographic context in PowerPoint and Google Slides with the Africa Dotted Map Infographic. This dotted map of Africa gives you a clean base for coverage, footprint, and regional updates. You can communicate location-driven messages quickly while keeping the slide easy to scan.
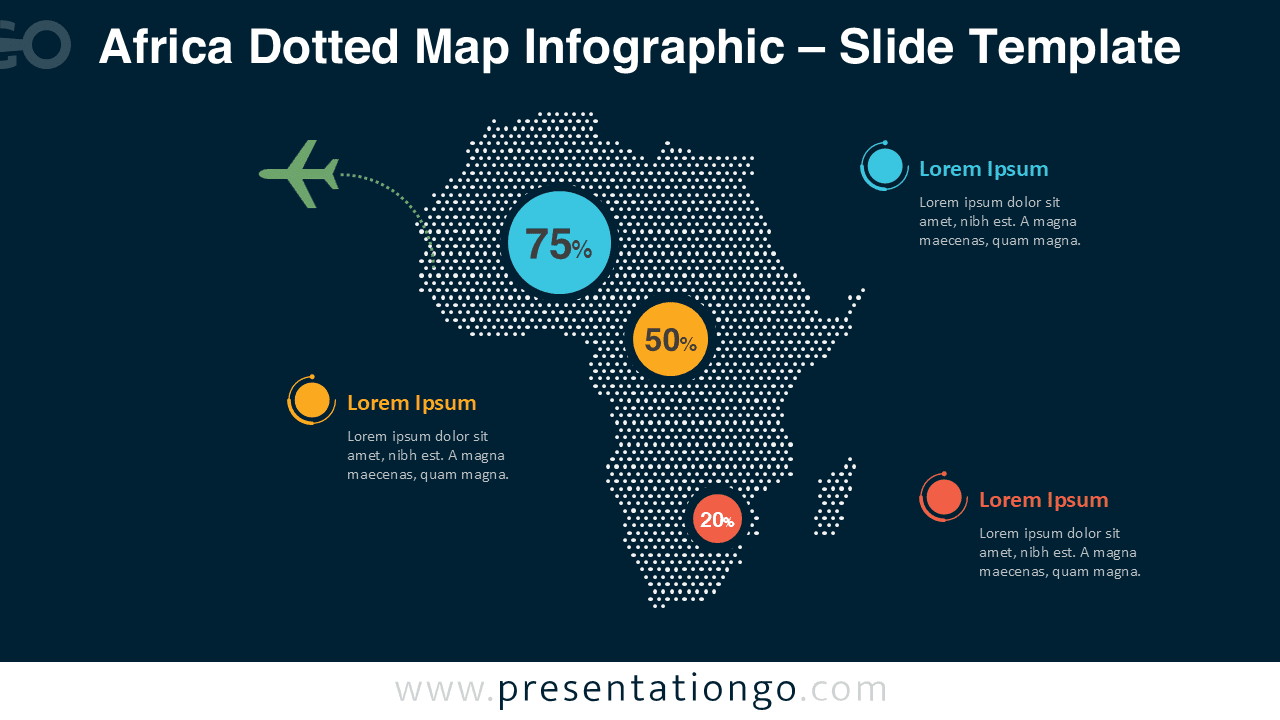
Use the light version for reports and document-style decks. Switch to the dark version when you need stronger contrast for stage screens or modern themes. The minimal dot pattern keeps attention on your story, not on heavy cartography.
Map Preview
Features and Customization Options
- Editable vector map shapes for sharp scaling on any slide size
- Editable dot pattern that you can recolor to match your brand
- Editable shapes, arrows, and text placeholders for quick callouts
- Light and dark background versions for flexible deck themes
- Compatible with PowerPoint and Google Slides
- Easy grouping for fast selection, alignment, and duplication
- Works smoothly with pins, labels, and KPI blocks you add on top
Design and Structure
The design uses a dot matrix style to reduce visual noise while preserving recognizable geography. It keeps coastlines readable without thick outlines. You can place the map as a full-slide hero visual, or use it as a side element next to metrics.
For emphasis, apply one accent color to highlight priority regions, then keep everything else neutral. Short labels read best, especially when you align callouts in a tidy column. Add arrows to explain movement, growth, or routes across the continent.
Practical Applications
- Show market presence across Africa in strategy, sales, and investor decks
- Map program coverage for NGO, health, and education reporting
- Highlight logistics routes, hubs, and service areas with arrows and callouts
- Support research findings with clear regional context and simple labels
- Introduce country groupings before charts, tables, and dashboards
- Create executive summaries with the map paired with KPIs and notes
Summary
The Africa Dotted Map Infographic helps you explain geography with speed and clarity. Recolor the dots, add labels, and build callouts in minutes. Use it in PowerPoint and Google Slides for consistent regional storytelling on light or dark backgrounds.