

The Africa Insights Map helps you present geographic information in a clear, structured, and engaging format. It combines an editable map of Africa with four supporting insight sections and a central highlight box. This layout works well when you need to connect regional data with concise explanations. You can use it for market research, business planning, education, nonprofit reporting, or country comparisons. The slide is available for PowerPoint and Google Slides, so you can adapt it to different presentation environments.
Slide Template Preview
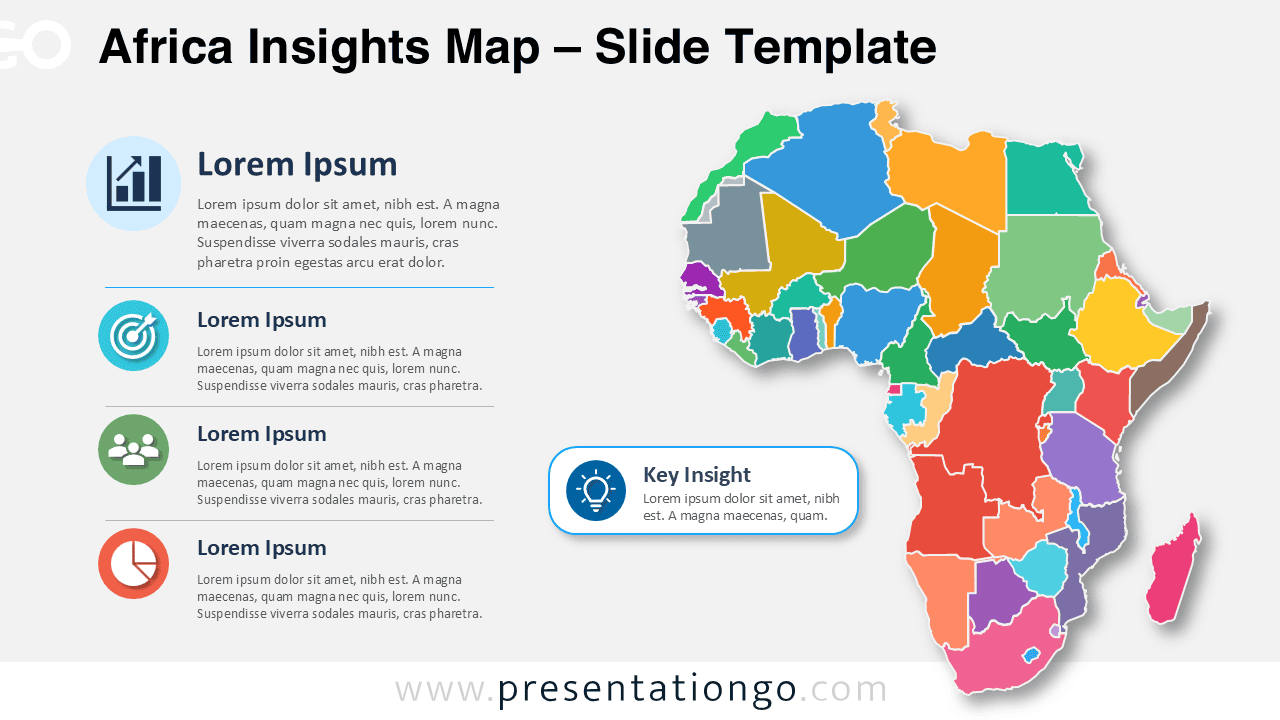
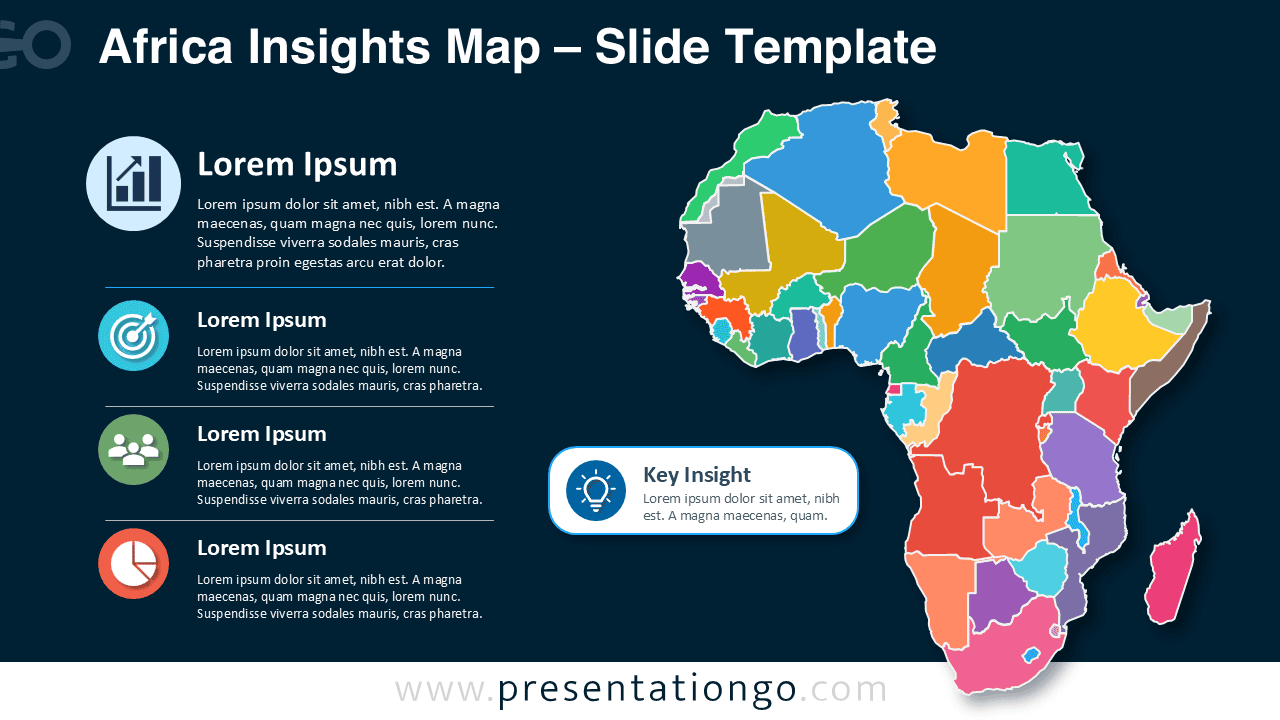


The design places the Africa map beside a structured content area. Each country appears as a separate editable shape, which makes regional highlighting easy. The four insight blocks help you summarize findings, trends, priorities, or recommendations. A central callout gives extra attention to an important conclusion or strategic message. The layout stays balanced and readable, even when you add detailed content.
Features and Customization Options
- Editable Africa map with individual country shapes
- Four structured insight sections for key findings
- Central callout for an important conclusion or recommendation
- Office icon library graphics that are easy to modify, replace, resize, and recolor
- Editable text, labels, shapes, and borders
- Compatible with PowerPoint and Google Slides
- Two slide versions for different presentation settings
- Suitable for business, education, research, and nonprofit use
Design and Structure
The Africa Insights Map uses a practical two-column composition. The explanatory content sits on the left, while the geographic visual occupies the right side. This arrangement creates a natural reading flow and keeps the slide focused. The icon placeholders help viewers identify each information block quickly. Because the icons come from the Office icon library, you can modify them directly without importing external graphics. You can also replace them with other Office icons that better match your subject.
The map supports many storytelling approaches. You can emphasize selected countries, group regions, identify territories, or compare areas. The text blocks can explain performance, priorities, risks, opportunities, or audience segments. The central insight box can summarize the most important takeaway from the slide.
Practical Applications
- Africa market entry presentations
- Regional business and sales analysis
- Country performance comparisons
- Economic and demographic reports
- Nonprofit and development updates
- Educational geography presentations
- Investment opportunity reviews
- Public policy and regional planning
Summary
The Africa Insights Map gives you a flexible way to combine geographic information with clear supporting commentary. Its editable map, organized insight sections, Office icons, and prominent callout make complex information easier to understand. You can adapt the layout for strategic, academic, commercial, or nonprofit presentations. The result is a focused slide that helps audiences understand both the regional context and the main message.



