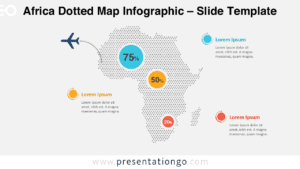
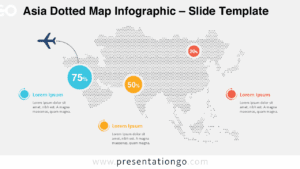
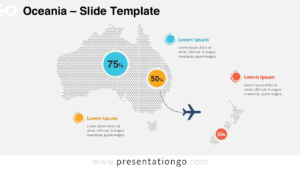
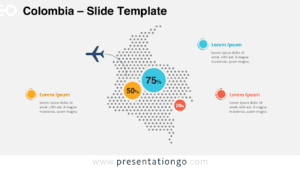
The Americas Dotted Map Infographic provides a modern and visually engaging way to present geographic data across North America, Central America, and South America. Designed for PowerPoint and Google Slides, this infographic uses a clean dotted pattern to represent the continent while allowing presenters to highlight key regions, statistics, or strategic insights.
This infographic layout is particularly useful when presenting regional performance, market expansion strategies, travel routes, or demographic information. The dotted map design keeps the slide visually light while still maintaining strong geographic recognition.
Map Preview
Features and Customization Options
- Editable dotted map of North, Central, and South America
- Fully customizable shapes, colors, and text elements
- Includes layouts optimized for PowerPoint and Google Slides
- Color-coded markers for highlighting statistics or regions
- Clean infographic layout suitable for professional presentations
- Easy-to-edit design for market analysis or geographic reporting
Design and Structure
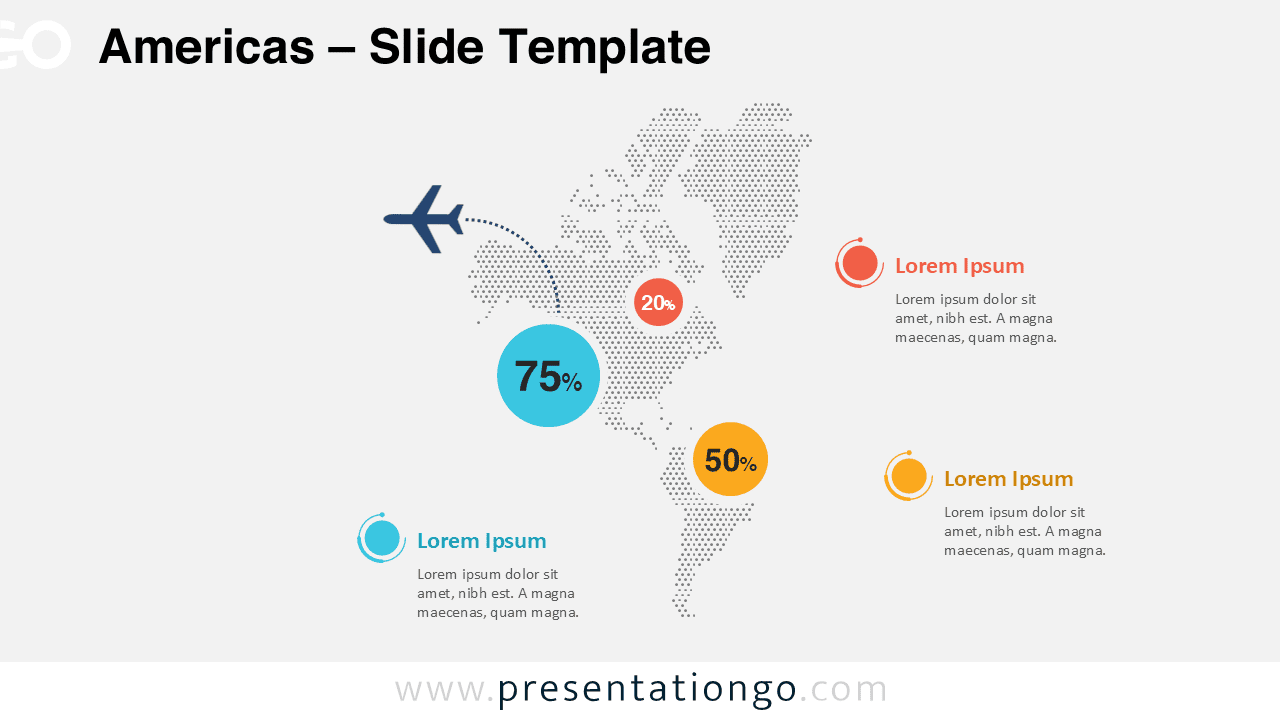
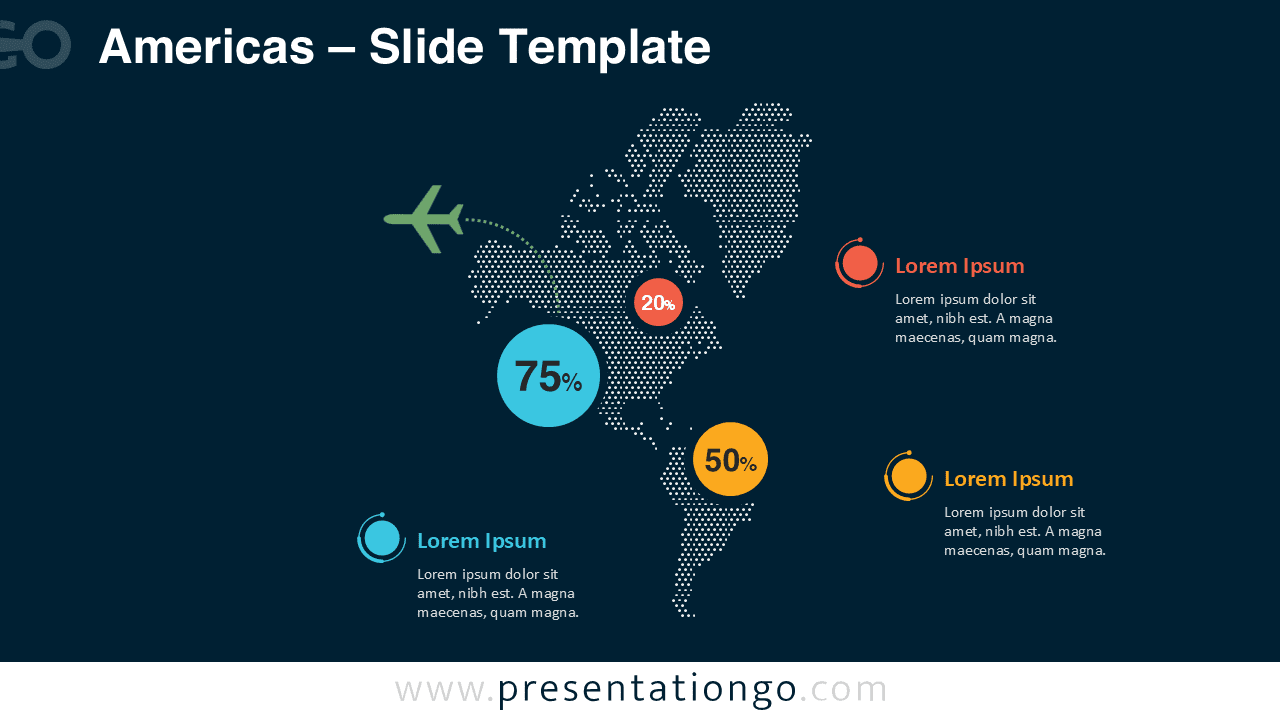
The Americas Dotted Map Infographic features a clear continental layout built from evenly spaced circular dots. This dotted structure creates a modern visualization style that works well with corporate presentations and data storytelling.
Several highlighted markers allow presenters to emphasize specific regions with percentages, icons, or short descriptions. These markers can represent key metrics such as regional growth, sales distribution, travel routes, or population statistics.
Two slide versions are included, allowing the infographic to work perfectly with both light and dark presentation themes. This flexibility ensures the map integrates seamlessly into a wide range of presentation styles.
Practical Applications
- Regional market expansion presentations
- Sales performance across the Americas
- Logistics and transportation routes
- International business strategy discussions
- Geographic distribution of customers or resources
- Population or economic data visualization
Summary
The Americas Dotted Map Infographic is a versatile and visually appealing solution for geographic presentations. Its clean dotted design, editable markers, and flexible layout make it ideal for business reports, market analysis, and global strategy presentations. Whether highlighting regional performance or illustrating travel routes, this infographic helps transform complex geographic information into clear and engaging visuals.