• Blog

Bar Chart with Cars for PowerPoint

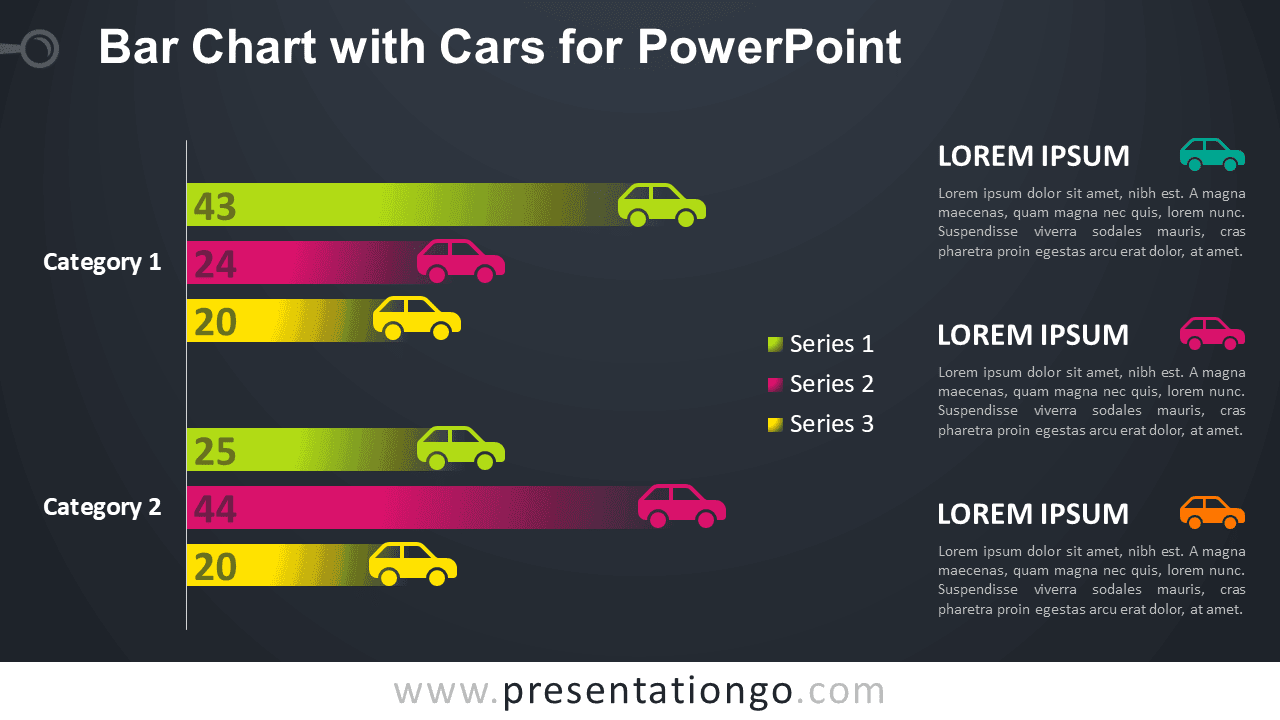
Data-driven clustered bar chart with colored cars on the edge of each horizontal bars.

PPTX

4:316:9

Free Horizontal Bar Chart with Cars for PowerPoint

Free bar chart with cars for PowerPoint. Data-driven clustered bar chart with colored cars on the edge of each horizontal bars. Editable graphics with text and icon placeholders.

Bar Chart with Cars

Use this quantitative template when you want to illustrate results on a topic about cars or transportation in general, for example. Or just to capture your audience’s attention..

Shapes are 100% editable: colors and sizes can be easily changed.

Built-in data driven PowerPoint chart: you can easily change data series and format.

Includes 2 slide option designs: Standard (4:3) and Widescreen (16:9).

Widescreen (16:9) size preview:
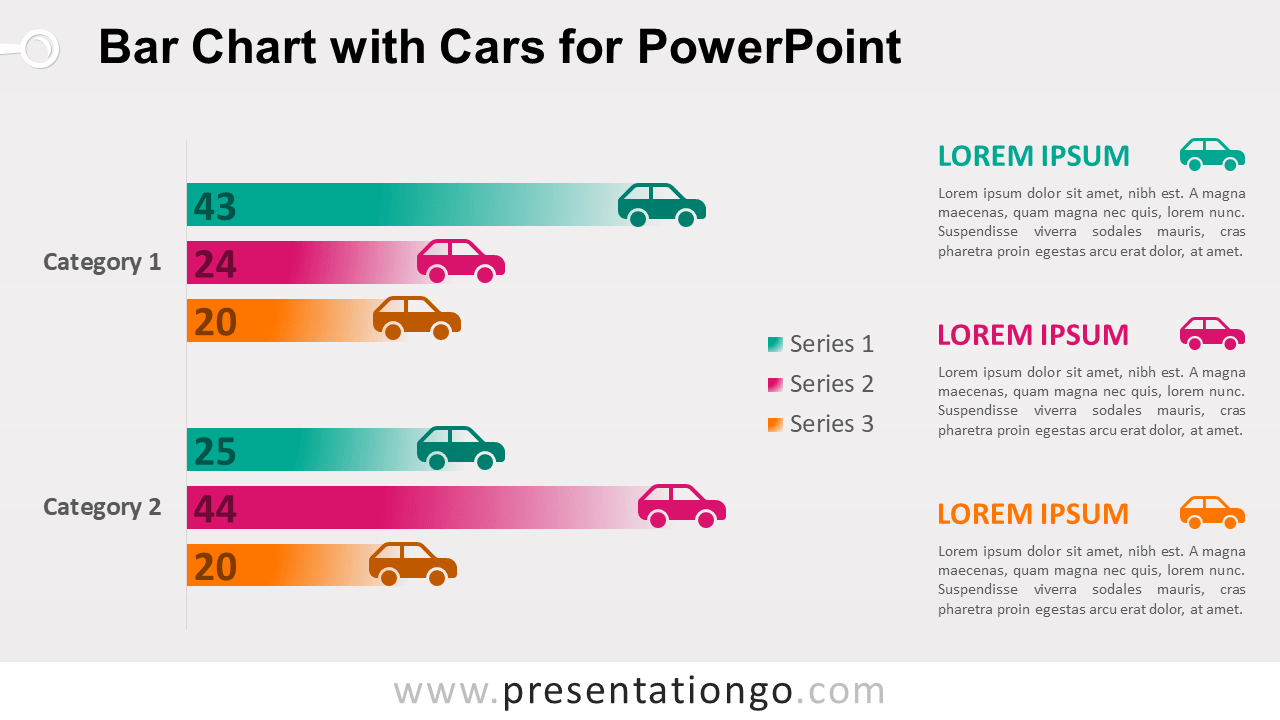
This ‘Bar Chart with Cars for PowerPoint’ features:

  • 2 unique slides
  • Light and Dark layout
  • Ready to use template with text and icon placeholders
  • Completely editable shapes
  • Data-driven charts
  • Standard (4:3) and Widescreen (16:9) aspect ratios
  • PPTX file

Free fonts used:

  • Helvetica (System Font)
  • Calibri (System Font)
100% Free
  • No sign-up required
  • Unlimited downloads
  • Always free

Requires attribution — Terms · license without credit

PowerPoint
4:3 · PPTX · 105 KB
PowerPoint
16:9 · PPTX · 102 KB
Aspect ratio available: 4:3, 16:9

Terms of use

Free to use, with one condition

This template is free for personal, educational, and commercial work — as long as you credit PresentationGO.

Tap any item below for the full details ↓

Keep the "Design by PresentationGO" credit on your title or closing slide, or add a visible link to presentationgo.com if you remove it.

Use it freely for school, personal projects, and non-commercial presentations.

Use it in client work, pitches, and internal business presentations.

You can't resell the template itself or republish it on another template site, edited or not.