Skip to content
PresentationGO
  • Explore
    • Templates
      • Abstract
      • Sports
      • Business
      • Religion & Holidays
      • Nature
      • Technology
      • Professions
      • Flat Lays & Scenes
      • Health & Recreation
      • Color Palettes
      • Education
      • Food & Drink
      • Science
      • CertificatesNEW
      • All Templates
    • Charts & Diagrams
      • Processes
        • Circular
        • Linear
        • Alternating
        • Stairs
        • Bending
      • Funnels
      • Pyramids
      • Matrix Charts
      • Business Models
      • Non-Data-Driven Chart Alternatives
      • Radial Diagrams
      • Flow Charts
      • Data-Driven Charts & Graphs
      • Organizational Charts
      • Clusters & Relationships
      • Venn Diagrams
      • All Charts & Diagrams
    • Text & Tables
      • Text Boxes
      • Comparisons
      • Paper & Banners
      • Numbered Lists
      • Speaking Bubbles
      • Pricing Tables
      • Bullet Point / Text Layouts
      • Contents & Table of Contents
      • Quotes
      • Word Clouds
      • To-do & Checklists
      • All Text & Tables
    • Timelines & Planning
      • Calendars
      • Timelines
      • Gantt Charts
      • Agenda
      • All Timelines & Planning
    • Graphics & Metaphors
      • Concepts
      • Silhouettes & People
      • Light Bulbs
      • Trees
      • Letters & Numbers
      • Signs
      • Mockups
      • Food
      • Money
      • Road
      • Target and Goals
      • All Graphics & Metaphors
    • Maps & Flags
      • Flag Templates
      • Continent Maps
      • Country Maps
        • Africa
        • Asia
        • Australia / Oceania
        • Europe
        • North America
        • South America
      • World Maps
      • All Maps
    • AI ImagesNEW
  • Search by
    • Colors
      • Black
      • Blue
      • Brown
      • Gray
      • Green
      • Cream
      • Light Blue
      • Orange
      • Pink
      • Purple
      • Gold
      • Red
      • White
      • Yellow
      • Teal
    • Steps (Options)
      • 2 options
      • 3 options
      • 4 options
      • 5 options
      • 6 options
      • 7 options
      • 8 options
      • 9 options
      • 10 options
      • 12 options
  • Templates
  • Charts & Diagrams
  • Text & Tables
  • Timelines & Planning
  • Graphics & Metaphors
  • Maps & Flags
  • AI ImagesNEW

Charts & Diagrams

Transform complex data into clear visuals with our extensive collection of 1,707 Charts & Diagrams templates for PowerPoint and Google Slides. Choose from flowcharts, mind maps, data-driven graphs, organizational charts, and more to engage your audience and enhance your presentations.

Main Charts & Diagrams Categories:ProcessesShapesRadial DiagramsMatrix ChartsGeometric ShapesNon-Data-Driven Chart AlternativesBusiness ModelsData-Driven Charts & GraphsFlow ChartsOrganizational ChartsStagesVenn DiagramsMulti-Level ChartsClusters & RelationshipsTrees
Widescreen version of three-panel waffle charts with light background, designed for PowerPoint and Google Slides presentations.
Charts & Diagrams
3 options

Three-Panel Waffle Charts

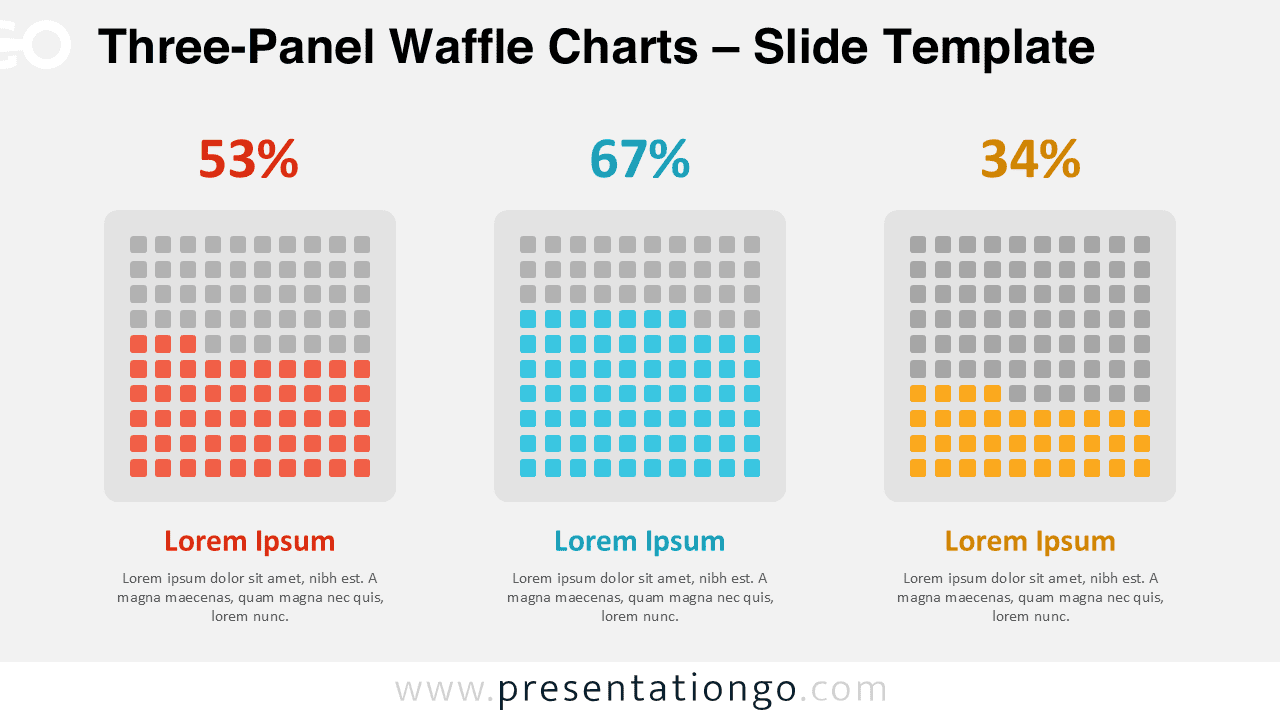
Show segmented statistics clearly using three customizable waffle charts in one aligned layout for easy analysis.

Google Slides, PPTX

4:316:9

Editable waffle chart slide with a light background for PowerPoint and Google Slides, showing side-by-side percentage comparison grids.
Charts & Diagrams
2 options

Two-Panel Waffle Charts

A simple yet powerful way to show two distinct metrics side by side using visual grids.

Google Slides, PPTX

4:316:9

Widescreen CLV template with a light background, showing 3 key customer journey stages and editable area chart in Google Slides.
Charts & Diagrams

CLV (Customer Lifetime Value)

A 3-stage diagram illustrating acquisition, retention, and expansion with a smooth area chart to highlight customer growth and retention impact.

Google Slides, PPTX

4:316:9

Widescreen PDCA Cycle template with light background for PowerPoint and Google Slides, featuring Plan, Do, Check, and Act steps.
Charts & Diagrams
4 options

The PDCA Cycle

Visualize the Plan-Do-Check-Act cycle to support quality planning and strategic iteration on your slides.

Google Slides, PPTX

4:316:9

Light background version of the Crosswise Quadrant Diagram showing 4 labeled segments and icons in a half-frames design.
Charts & Diagrams
4 options

Crosswise Quadrant Diagram

This quadrant template uses a converging layout and half-frame design to present 4 options clearly and symmetrically.

Google Slides, PPTX

4:316:9

Widescreen PowerPoint and Google Slides diagram with 8 circular neumorphic steps on a light background, ideal for process presentations.
Charts & Diagrams
8 options

8-Step Neumorphic Cycle Diagram

Present eight-stage workflows with this editable, neumorphic-style cycle diagram for PowerPoint and Google Slides.

Google Slides, PPTX

4:316:9

Widescreen PowerPoint and Google Slides diagram with 7 circular neumorphic steps on a light background, ideal for process presentations.
Charts & Diagrams
7 options

7-Step Neumorphic Cycle Diagram

Display 7 interconnected steps in a balanced, radial layout with this neumorphic cycle diagram, ideal for process visualization.

Google Slides, PPTX

4:316:9

Widescreen PowerPoint and Google Slides diagram with 6 circular neumorphic steps on a light background, ideal for process presentations.
Charts & Diagrams
6 options

6-Step Neumorphic Cycle Diagram

Present six interconnected steps in a continuous loop using this neumorphic-style diagram template for PowerPoint and Google Slides.

Google Slides, PPTX

4:316:9

Widescreen PowerPoint and Google Slides diagram with 5 circular neumorphic steps on a light background, ideal for process presentations.
Charts & Diagrams
5 options

5-Step Neumorphic Cycle Diagram

Display five connected stages with this editable neumorphic cycle diagram—perfect for illustrating circular workflows or ongoing processes.

Google Slides, PPTX

4:316:9

Four-step Neumorphic diagram with a light background, featuring circular nodes and editable text for PowerPoint and Google Slides.
Charts & Diagrams
4 options

4-Step Neumorphic Cycle Diagram

Present four interrelated steps around a core idea with this editable Neumorphic diagram for PowerPoint and Google Slides.

Google Slides, PPTX

4:316:9

Editable six-level pyramid template for PowerPoint and Google Slides with a light background and labeled text boxes on each side.
Charts & Diagrams
6 options

Six-Level Tiered Pyramid

Display step-by-step workflows or layered information with this clean six-part pyramid diagram, ready for PowerPoint and Google Slides.

Google Slides, PPTX

4:316:9

Widescreen five-level pyramid for PowerPoint and Google Slides with a light background, color-coded tiers, and linked text sections.
Charts & Diagrams
5 options

Five-Level Tiered Pyramid

Use this five-tiered pyramid to present hierarchical levels, strategic stages, or growth models with clear alignment and visual balance.

Google Slides, PPTX

4:316:9

Older posts
Newer posts
← Previous Page1 … Page17 Page18 Page19 … Page143 Next →
Search Templates by categories
Templates Charts & Diagrams Text & Tables Maps & Flags Timelines & Planning Graphics & Metaphors
Search Templates by colors
Support us
icon of a coffee cup for 'support us' - PresentationGo
... buying us a coffee

Love our templates? Show your support with a coffee!

Donate Here

Thank you for fueling our creativity!

Logotype PresentationGo
Content

Templates

Charts & Diagrams

Text & Tables

Graphics & Metaphors

Timelines & Planning

Maps

AI ImagesNEW

Best-Ofs & Tips

Legal

Terms and Conditions

Privacy Statement

Cookie Policy

Digital Millennium Copyright Act (DMCA) Policy

Disclaimer

Help

Contact us

FAQ

Templates

Charts & Diagrams

Text & Tables

Graphics & Metaphors

Timelines & Planning

Maps

Best-Ofs & Tips

Terms and Conditions

Privacy Statement

Cookie Policy

Digital Millennium Copyright Act (DMCA) Policy

Disclaimer

Contact us

FAQ

© Copyright 2026 Ofeex | PRESENTATIONGO® is a registered trademark | All rights reserved.

PresentationGO
Cookies & Privacy

To provide the best experiences, we and our partners use technologies like cookies to store and/or access device information. Consenting to these technologies will allow us and our partners to process personal data such as browsing behavior or unique IDs on this site and show (non-) personalized ads. Not consenting or withdrawing consent, may adversely affect certain features and functions.

Click below to consent to the above or make granular choices. Your choices will be applied to this site only. You can change your settings at any time, including withdrawing your consent, by using the toggles on the Cookie Policy, or by clicking on the manage consent button at the bottom of the screen.

Functional Always active
Needed for the website to work properly.
Preferences
Remember your settings (like language or display choices).
Statistics
The technical storage or access that is used exclusively for statistical purposes. Help us understand how the site is used so we can improve it (Google Analytics).
Marketing
Used to show relevant ads and measure ad performance (Google AdSense and partners).
Statistics

Marketing

Features
Always active

Always active
  • Manage options
  • Manage services
  • Manage {vendor_count} vendors
  • Read more about these purposes
Manage preferences
  • {title}
  • {title}
  • {title}
PresentationGO
Cookies & Privacy

We use cookies to run the site, measure traffic, and show ads that help keep our downloads free. Manage your choices anytime.

Functional Always active
Needed for the website to work properly.
Preferences
Remember your settings (like language or display choices).
Statistics
The technical storage or access that is used exclusively for statistical purposes. Help us understand how the site is used so we can improve it (Google Analytics).
Marketing
Used to show relevant ads and measure ad performance (Google AdSense and partners).
Statistics

Marketing

Features
Always active

Always active
  • Manage options
  • Manage services
  • Manage {vendor_count} vendors
  • Read more about these purposes
Manage preferences
  • {title}
  • {title}
  • {title}

Thank you for downloading from PresentationGO!

AI Images are free to use with no attribution required (though appreciated).

Presentation templates are also free, but require attribution.
For example, you can include this credit somewhere visible:

If you enjoy our free resources and want to support us, you can:

Buy us a coffee

Thank you for your continued support!