Free cycle matrix pie chart for PowerPoint. Non-data-driven chart with 4 pies or wedges, and text shapes to the side of each pie shape. Editable graphics with icon and text placeholders.
Cycle Matrix Pie Chart
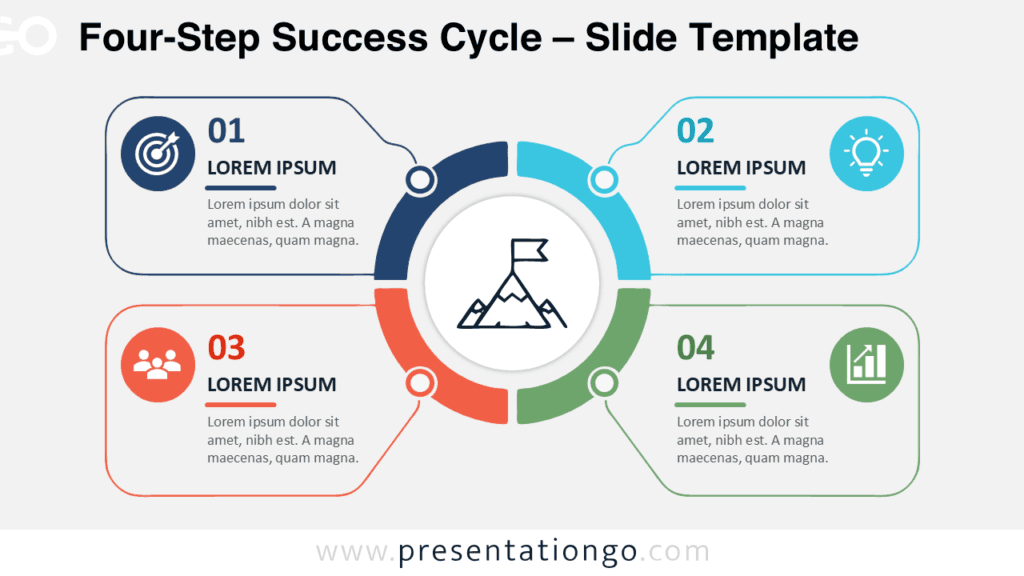
The 2×2 matrix is commonly used in business strategy as a representational tool to show conflicting concepts and for decision making. This four-quadrant matrix diagram is perfect to be used for business or marketing matrices like BCG, SWOT, Ansoff, risk assessment…
Use to show the relationship to a central idea in a cyclical progression.
You can also use this diagram as a circular process with 4 steps.
Shapes are 100% editable: colors and sizes can be easily changed.
Includes 2 slide option designs: Standard (4:3) and Widescreen (16:9).
Widescreen (16:9) size preview:


This ‘Cycle Matrix Pie Chart for PowerPoint’ features:
- 2 unique slides
- Light and Dark layout
- Ready to use template with icon and text placeholders
- Completely editable shapes
- Uses a selection of editable PowerPoint icons
- Standard (4:3) and Widescreen (16:9) aspect ratios
- PPTX file
Free fonts used:
- Helvetica (System Font)
- Calibri (System Font)