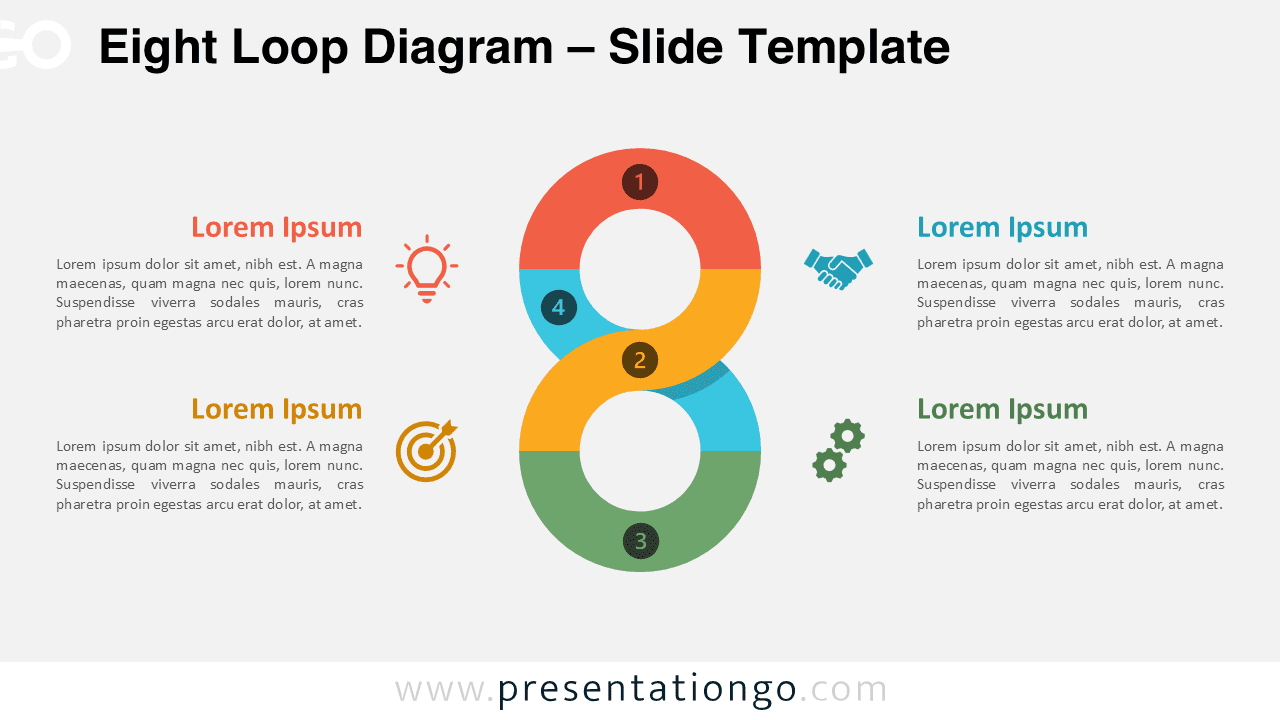
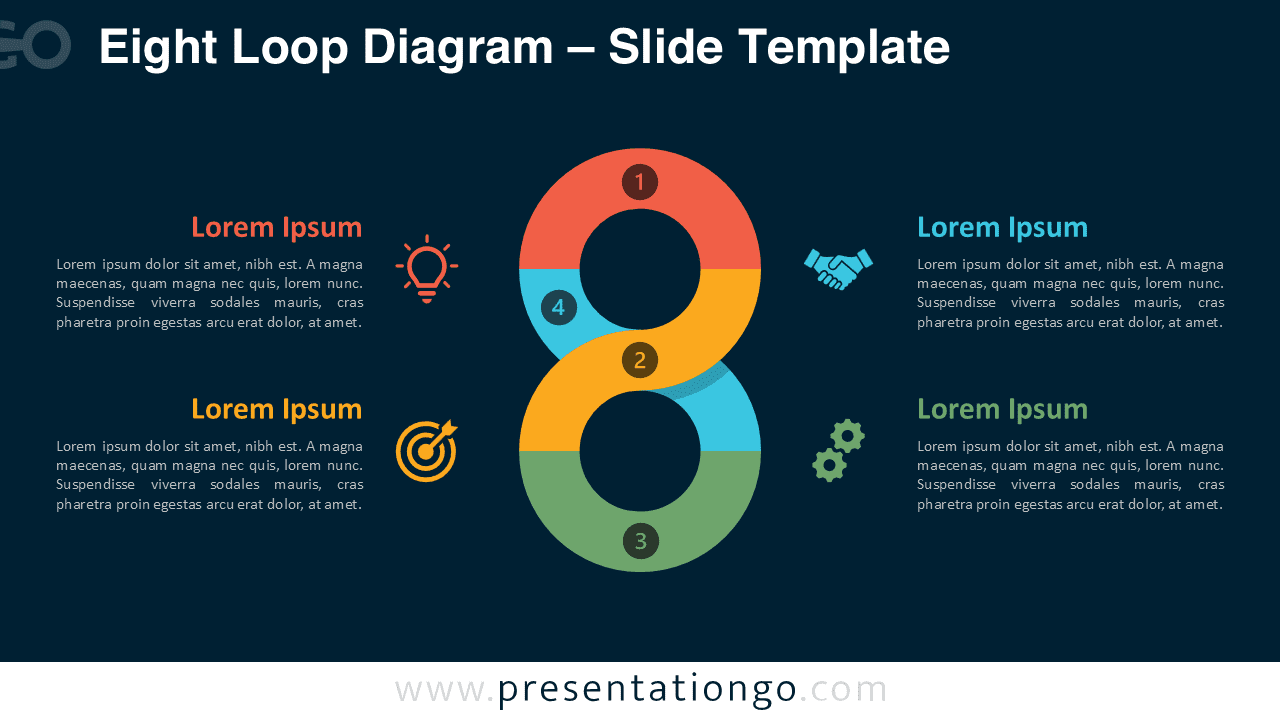
The Eight Loop Diagram presents four interconnected stages in a continuous figure-eight formation, designed for PowerPoint and Google Slides presentations.
A Balanced Visual for Cyclical Processes with Four Steps
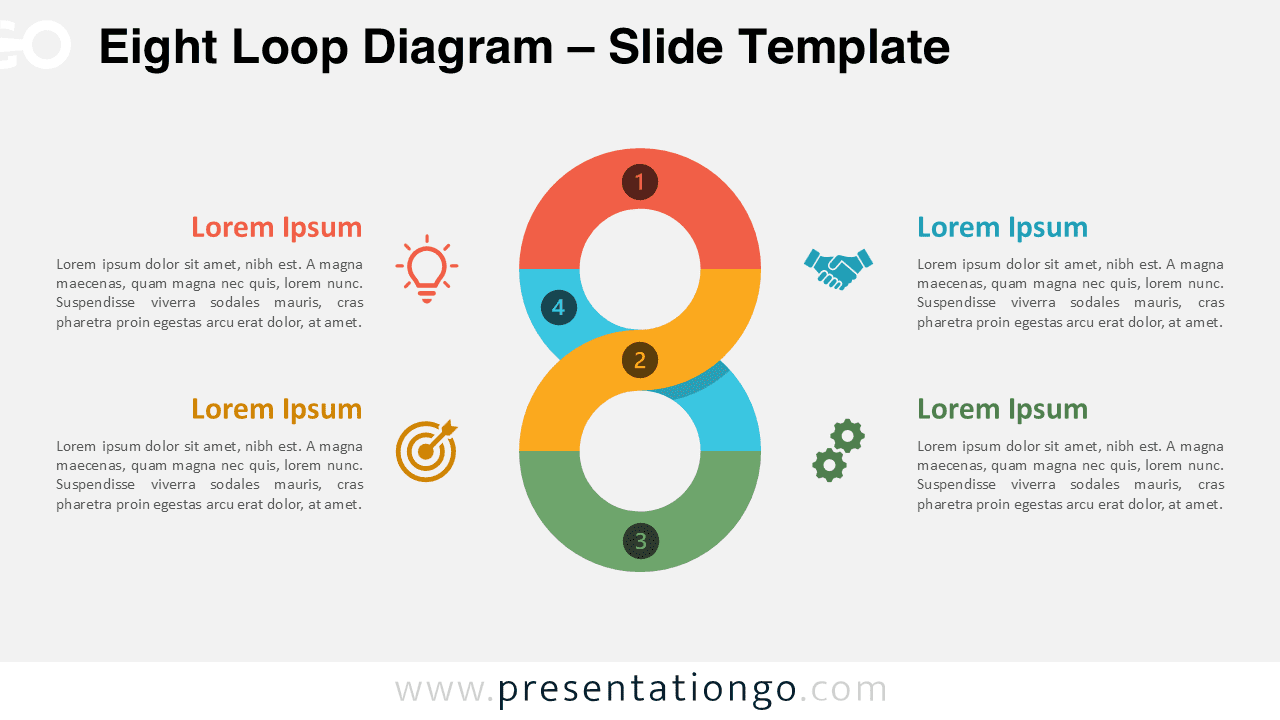
This diagram presents a continuous “8”-shaped loop divided into four numbered quadrants, forming a symmetrical and seamless flow across the center of the slide. Each quadrant features a large circular marker with a number (1–4), indicating the sequence. Text boxes and icon pairs are symmetrically placed on either side—two on the left and two on the right—matching the flow of the loop. The clean layout is enhanced by distinct icons and bold titles, helping audiences quickly associate each segment with its corresponding idea. Additionally, the use of color-coded segments ensures each phase of the loop is visually distinguishable, supporting intuitive understanding.
Circular loop diagrams are particularly useful in presentations where you need to communicate ongoing systems or continuous improvements. This specific design is ideal for showing four interdependent phases, such as feedback cycles, project iterations, or strategic planning loops. For example, a product development team could use it to outline the lifecycle stages—Research, Design, Launch, and Review—demonstrating how each leads into the next in a sustainable cycle.
The template includes two slides: one with a light theme and another with a dark theme. Each slide is pre-filled with thematic icons and text placeholders, saving time for customization. All shapes are fully editable, allowing users to adjust colors or swap icons as needed. It’s offered in both Standard (4:3) and Widescreen (16:9) formats, compatible with PowerPoint (PPTX) and Google Slides.
Download this four-step loop diagram to visualize any continuous process with clarity and visual symmetry.
Widescreen (16:9) size preview:


This template offers:
- 2 unique slides
- Options for both light and dark themes
- Pre-populated with icons (including numbers) and text placeholders
- Fully customizable shapes for complete control
- Available in both Standard (4:3) and Widescreen (16:9) ratios
- Offered in both PowerPoint PPTX and Google Slides formats