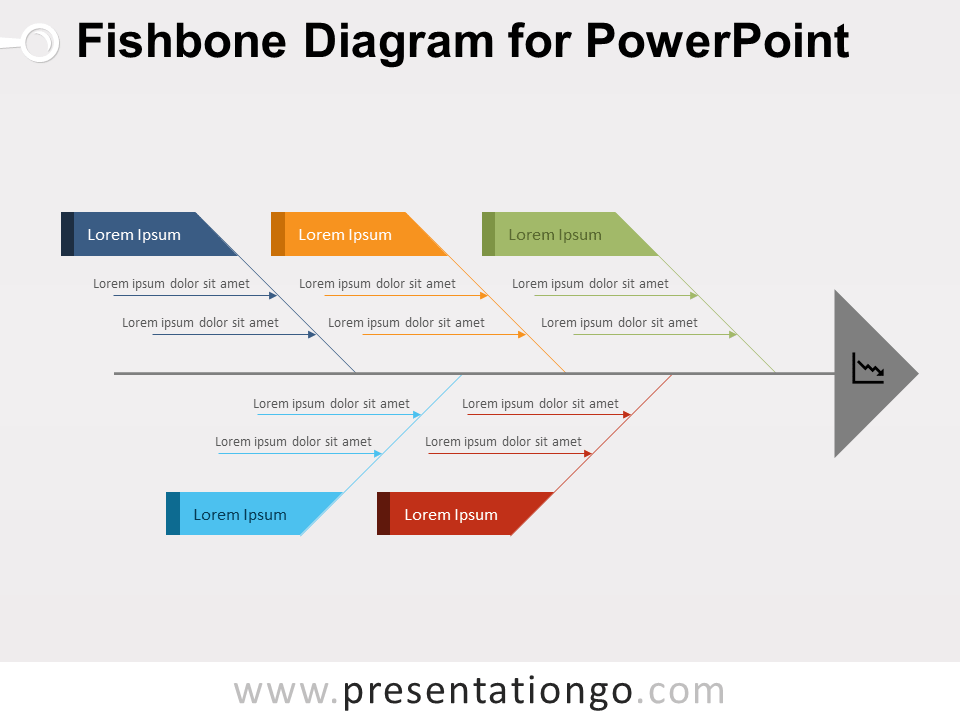
Free simple fishbone (Ishikawa) diagram template for PowerPoint. Simple cause and effect diagram with 5 fishbone shapes. Editable graphics with text placeholder.
Fishbone (Ishikawa) Diagram
Ishikawa diagrams (also called fishbone diagrams, herringbone diagrams, cause-and-effect diagrams, or Fishikawa) are causal diagrams created by Kaoru Ishikawa (1968) that show the causes of a specific event. Common uses of the Ishikawa diagram are product design and quality defect prevention to identify potential factors causing an overall effect.
— Source: Wikipedia
Use this fishbone diagram to show, through a series of steps, how several chaotic ideas (Cause) can result in a unified goal or idea (Effect). Can also be used to show a progression or sequential steps in a task, process, or workflow.
Shapes are 100% editable: colors and sizes can be easily changed.
Includes 2 slide option designs: Standard (4:3) and Widescreen (16:9).
Widescreen (16:9) size preview:
This ‘Fishbone (Ishikawa) Diagram for PowerPoint’ features:
- 2 unique slides
- Light and Dark layout
- Ready to use template with text placeholder
- Completely editable shapes
- Standard (4:3) and Widescreen (16:9) aspect ratios
- PPTX file
Free fonts used:
- Helvetica (System Font)
- Calibri (System Font)


Comments are closed.