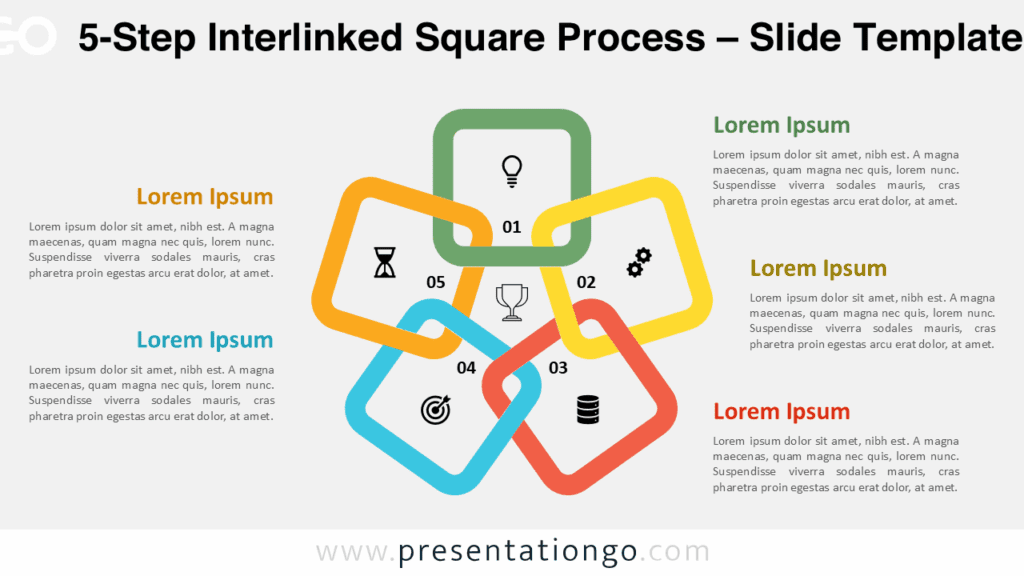
Free infographic cycle diagram for PowerPoint. Colorful cycle design with 5 stages, looking like braided strips. Editable graphics with text placeholder.
Infographic Cycle Diagram
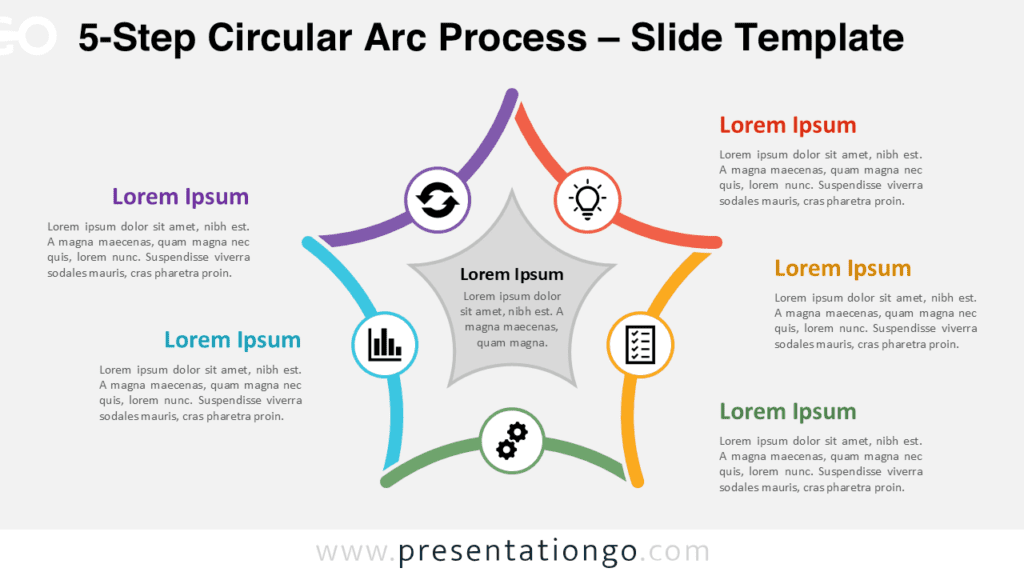
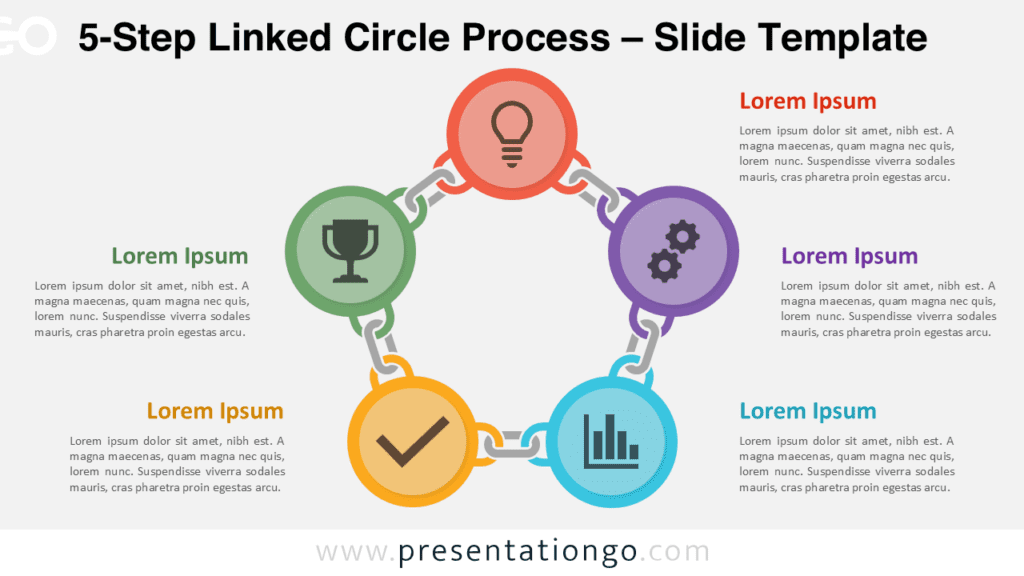
Use this circular diagram to represent a continuing sequence of 5 stages, tasks, or events in a circular flow. Can also be used to illustrate 5 ideas or concepts.
Shapes are 100% editable: colors and sizes can be easily changed.
The “Lorem Ipsum” text is for illustrative purposes only. Therefore, you should edit it to fit your own needs. Also, feel free to customize this diagram with your selection of icons (to insert an icon under PowerPoint, go to Insert > Icons…)
Includes 2 slide option designs: Standard (4:3) and Widescreen (16:9).
Widescreen (16:9) size preview:


This ‘Infographic Cycle Diagram for PowerPoint’ features:
- 2 unique slides
- Light and Dark layout
- Ready to use template with text placeholder
- Completely editable shapes
- Uses a selection of editable PowerPoint icons
- Standard (4:3) and Widescreen (16:9) aspect ratios
- PPTX file
Free fonts used:
- Helvetica (System Font)
- Calibri (System Font)