Free quadrant chart for PowerPoint and Google Slides. Scatter chart with four equal sections (quarters, or quadrants). Great data visualization chart to plot quantitative data. Editable graphics.
Quadrant Chart
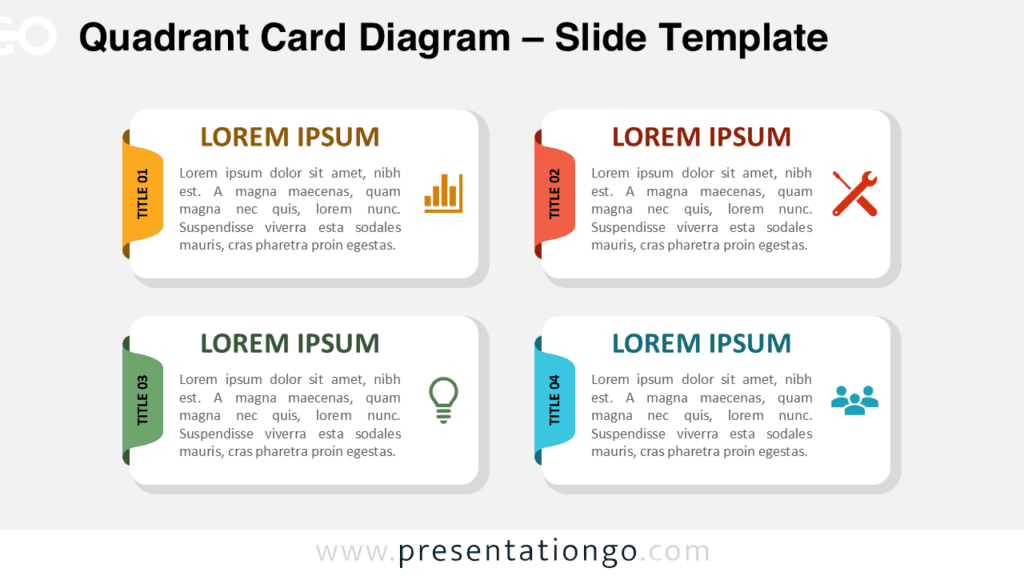
Quadrant charts are great illustrations for data visualization. These charts can be two or three-dimensional. Indeed, an extra dimension can be injected in the plot information, usually via the size of the bubbles.
Rectangle speech bubble shapes are used for the labels. Of course, you can’t really copy/paste the entire matrix ‘as it is’ in your slide. Instead, you have to alter it and adapt it with your own data and information. Still, the layout structure will probably help you optimize the design of the chart you will present.
Moreover, it is important to precise that this quadrant chart template is not data-driven. All the shapes and elements are editable though. You can also this template as a design base for other business matrices, such as a SWOT (strengths, weaknesses, opportunities, and threats) analysis.
Shapes are 100% editable: colors and sizes can be easily changed.
Includes 2 slide option designs: Standard (4:3) and Widescreen (16:9).
Widescreen (16:9) size preview:


This ‘Quadrant Chart for PowerPoint and Google Slides’ features:
- 2 unique slides
- Light and Dark layout
- Ready to use template
- Completely editable shapes
- Standard (4:3) and Widescreen (16:9) aspect ratios
- PPTX file and for Google Slides
Free fonts used:
- Helvetica (System Font)
- Calibri (System Font)