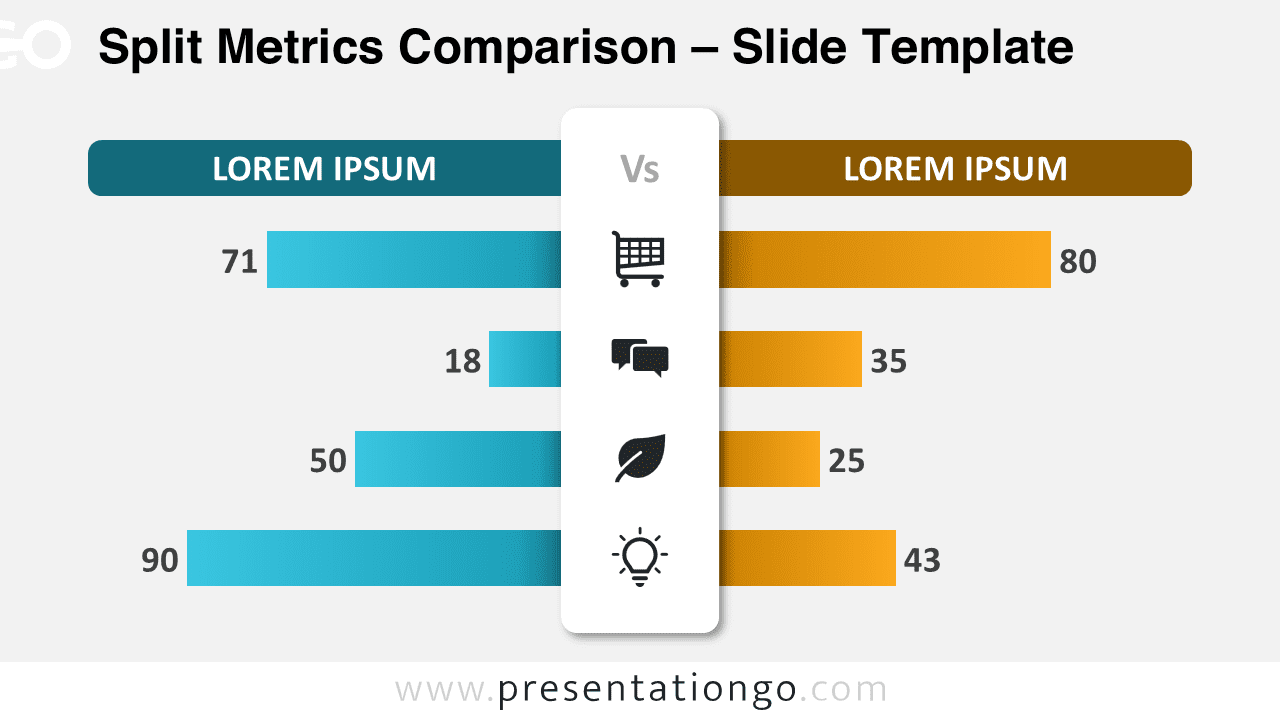
The Split Metrics Comparison provides a dual-sided bar chart format with four comparative metrics designed for PowerPoint and Google Slides.
Side-by-Side Infographic for Comparing Business Metrics
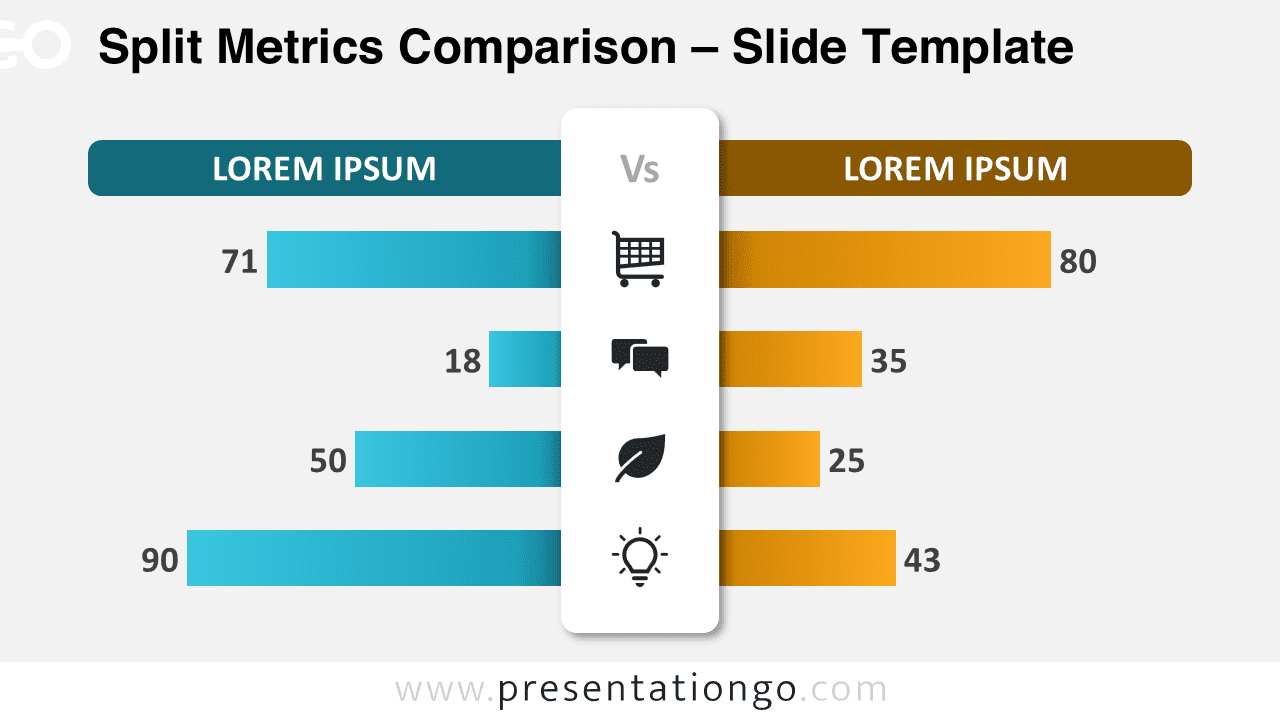
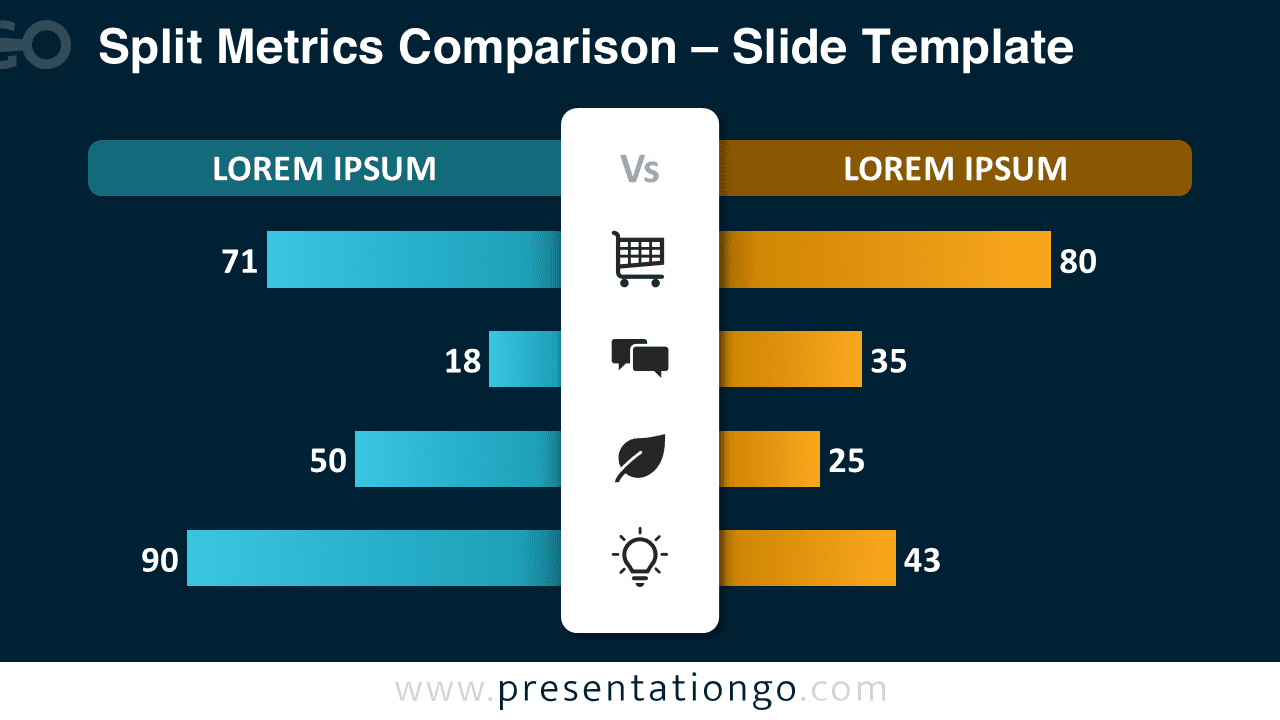
The template features a mirrored layout with opposing horizontal bar charts in contrasting blue and orange gradients. Each side displays four data bars that align perfectly with central icons, creating visual harmony between numerical data and categorical representation. The central column acts as both a separator and connector, housing distinct icons that correspond to each metric row. Furthermore, color-coded headers distinguish the two comparison groups, while data values appear directly on each bar for immediate reference. The symmetrical design ensures balanced visual weight across both sides.
Data chart comparisons serve as powerful decision-making assets in business presentations, enabling audiences to quickly assess performance differences between competing options. This diagram excels at showcasing comparative analysis between two products, quarterly results, team performances, or market research findings. Additionally, the template proves invaluable for budget comparisons, survey responses, competitor analysis, or before-and-after scenarios. The icon integration makes abstract concepts more accessible, while the horizontal bar format accommodates varying data ranges effectively.
This comprehensive template includes 2 unique slides featuring pre-populated icons and text placeholders for immediate customization. The fully customizable shapes allow complete control over colors, dimensions, and styling to match brand requirements. Data-driven bar-charts enable dynamic data representation that updates automatically when connected to external data sources. Both light and dark theme options provide flexibility for different presentation environments and audience preferences. The template supports Standard (4:3) and Widescreen (16:9) formats, ensuring compatibility across various display requirements. Complete compatibility with both PowerPoint PPTX and Google Slides guarantees seamless usage regardless of platform preference.
Download this 4-step comparison chart to highlight performance gaps or competitive differences in a clean, data-driven format.
Widescreen (16:9) size preview:


This template offers:
- 2 unique slides
- Options for both light and dark themes
- Pre-populated with icons and text placeholders
- Fully customizable shapes for complete control
- Data-driven pie-charts for dynamic data representation
- Available in both Standard (4:3) and Widescreen (16:9) ratios
- Offered in both PowerPoint PPTX and Google Slides formats