Latest Templates
Discover our vast, continually growing collection of free, high-quality, customizable templates & Infographics for PowerPoint and Google Slides presentations, designed to enhance your visual communication.
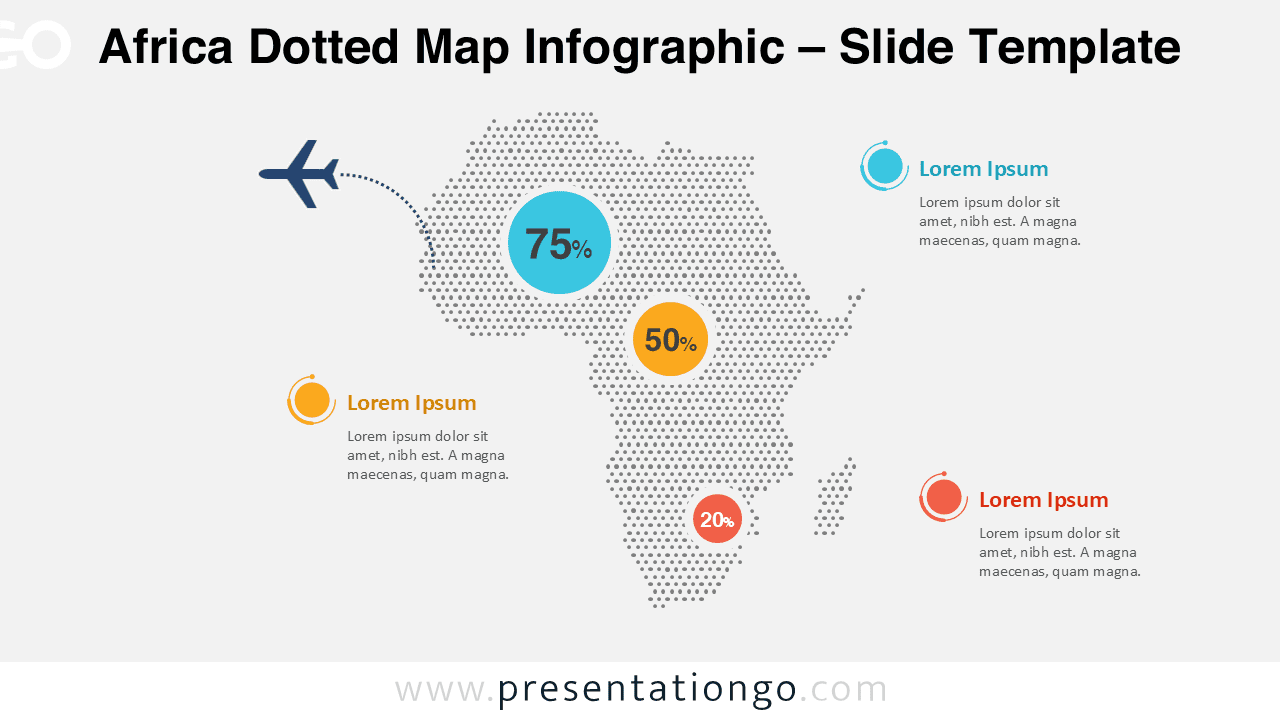
Africa Dotted Map Infographic
A clean Africa dotted map for regional context, coverage maps, and footprint slides. Fully editable in PowerPoint and Google Slides.
Google Slides, PPTX
16:9
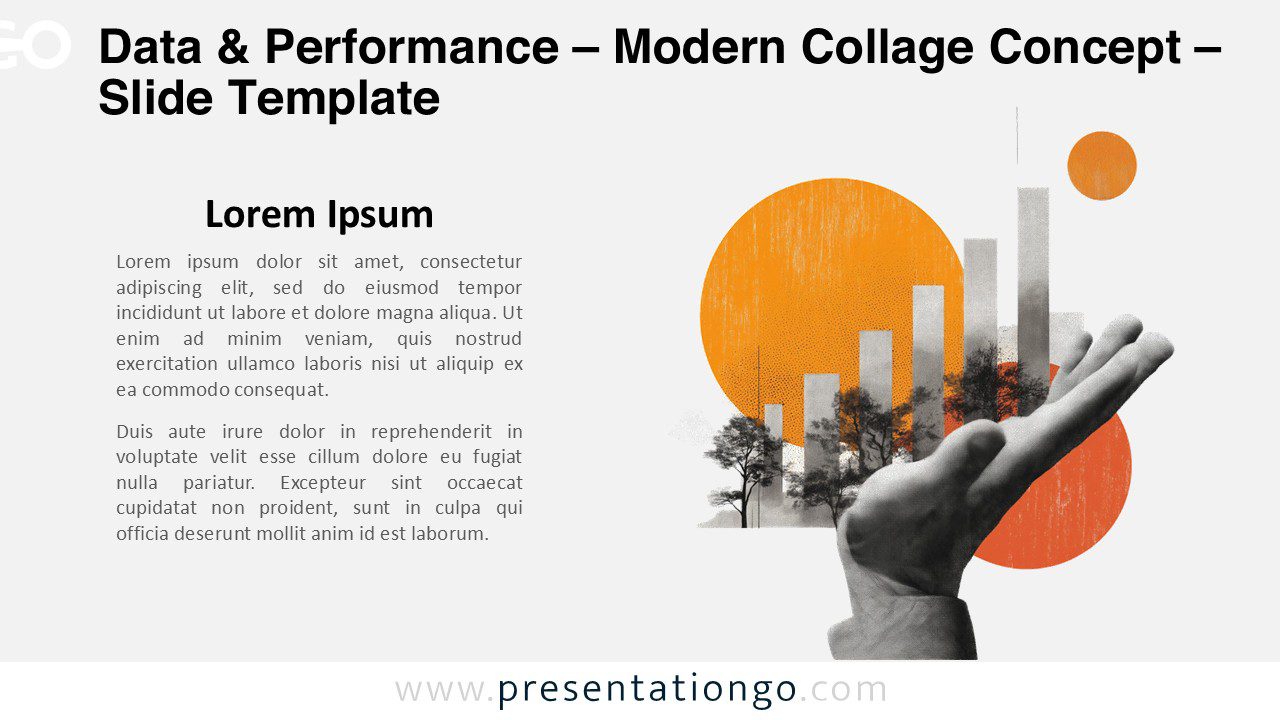
Data & Performance – Modern Collage Concept
A modern collage illustration focused on data and performance for your PowerPoint & Google Slides presentations.
Google Slides, PPTX
16:9

Information Exchange – Modern Collage Concept
Visualize collaboration and knowledge sharing in your PowerPoint and Google Slides presentations with a bold modern collage concept slide.
Google Slides, PPTX
16:9

Ideas & Creativity – Modern Collage Concept
Visualize inspiration and ideation in your PowerPoint and Google Slides presentations with a bold modern collage concept slide.
Google Slides, PPTX
16:9
6-Step Twisted Arrow Process
The 6-Step Twisted Arrow Process shows six milestones with a braided ribbon path and editable icon placeholders in PowerPoint and Google Slides.
Google Slides, PPTX
16:9
5-Step Twisted Arrow Process
The 5-Step Twisted Arrow Process shows five milestones with a braided ribbon path and editable icon placeholders in PowerPoint and Google Slides.
Google Slides, PPTX
16:9
4-Step Twisted Arrow Process
Visualize four milestones with a braided ribbon path that ends in an upward arrow. Great for plans, phases, and journeys.
Google Slides, PPTX
16:9
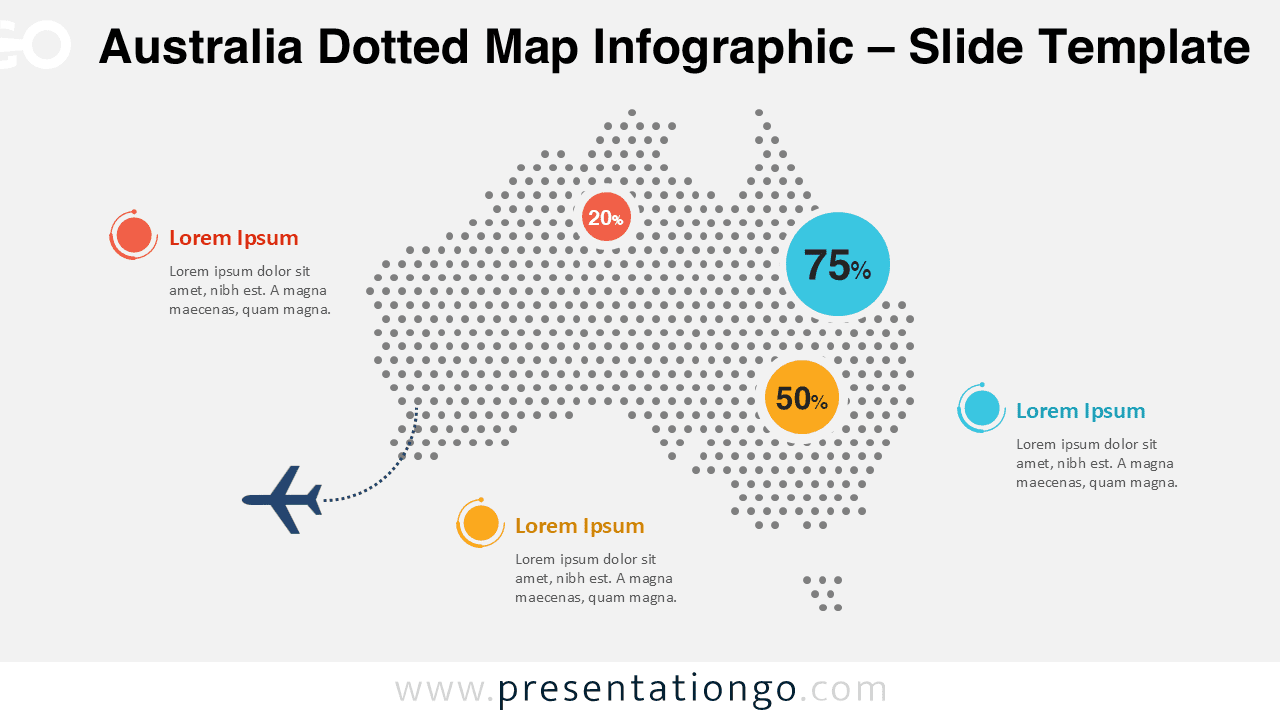
Australia Dotted Map Infographic
Present geographic data clearly using an editable Australia dotted map design.
Google Slides, PPTX
16:9
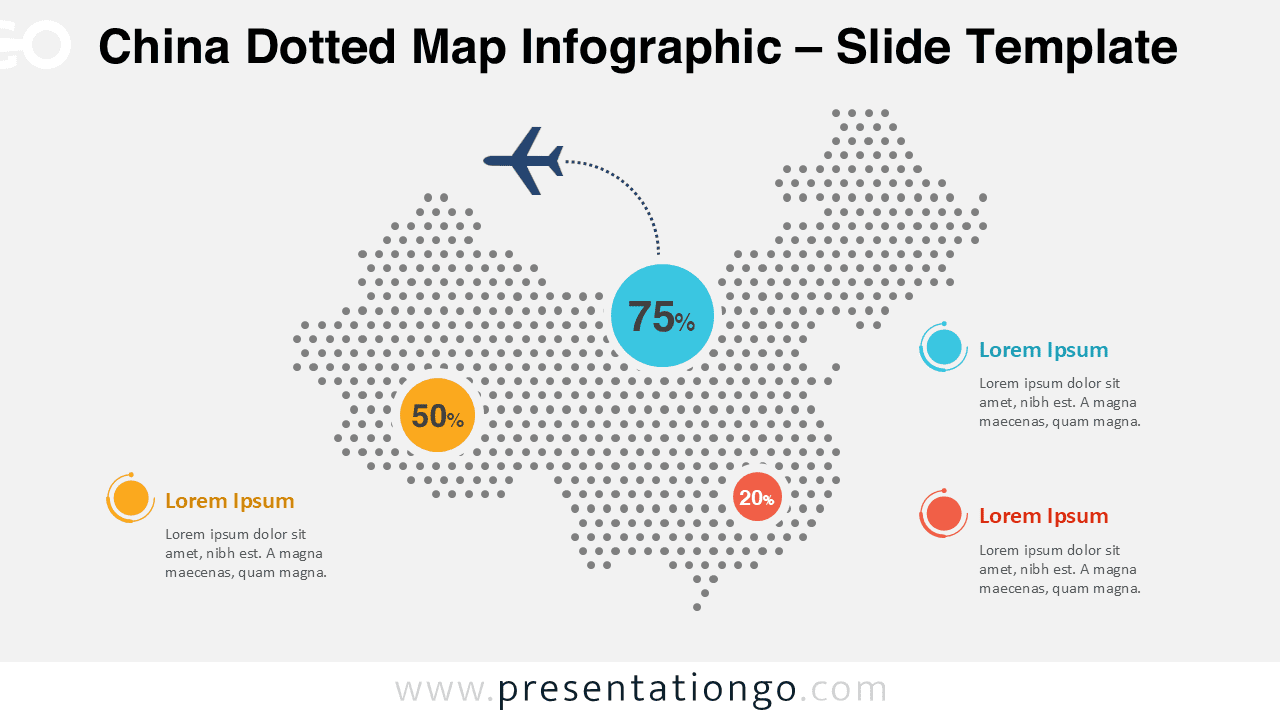
China Dotted Map Infographic
Present regional data clearly with this editable China dotted map in PowerPoint and Google Slides.
Google Slides, PPTX
16:9
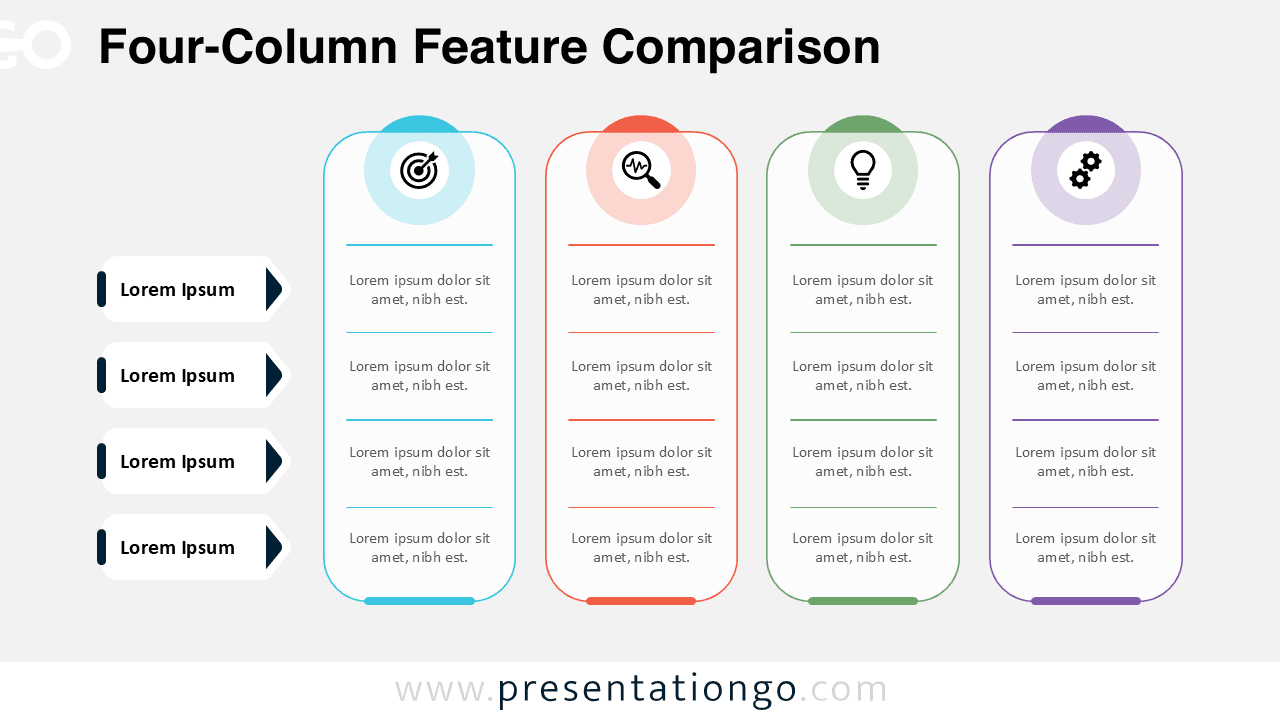
Four-Column Feature Comparison
A clean four-column feature comparison diagram for PowerPoint and Google Slides to showcase differences clearly.
Google Slides, PPTX
16:9
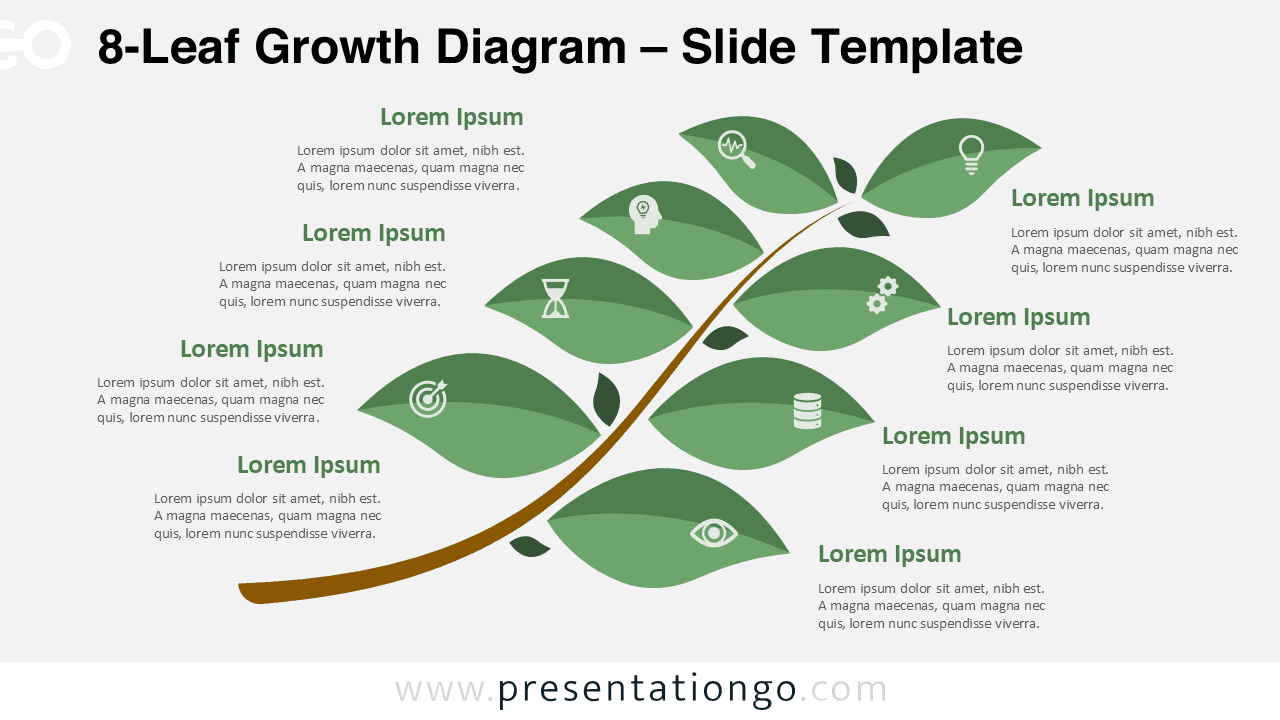
8-Leaf Growth Diagram
An 8-Leaf Growth Diagram for presenting detailed strategies in PowerPoint and Google Slides.
Google Slides, PPTX
16:9
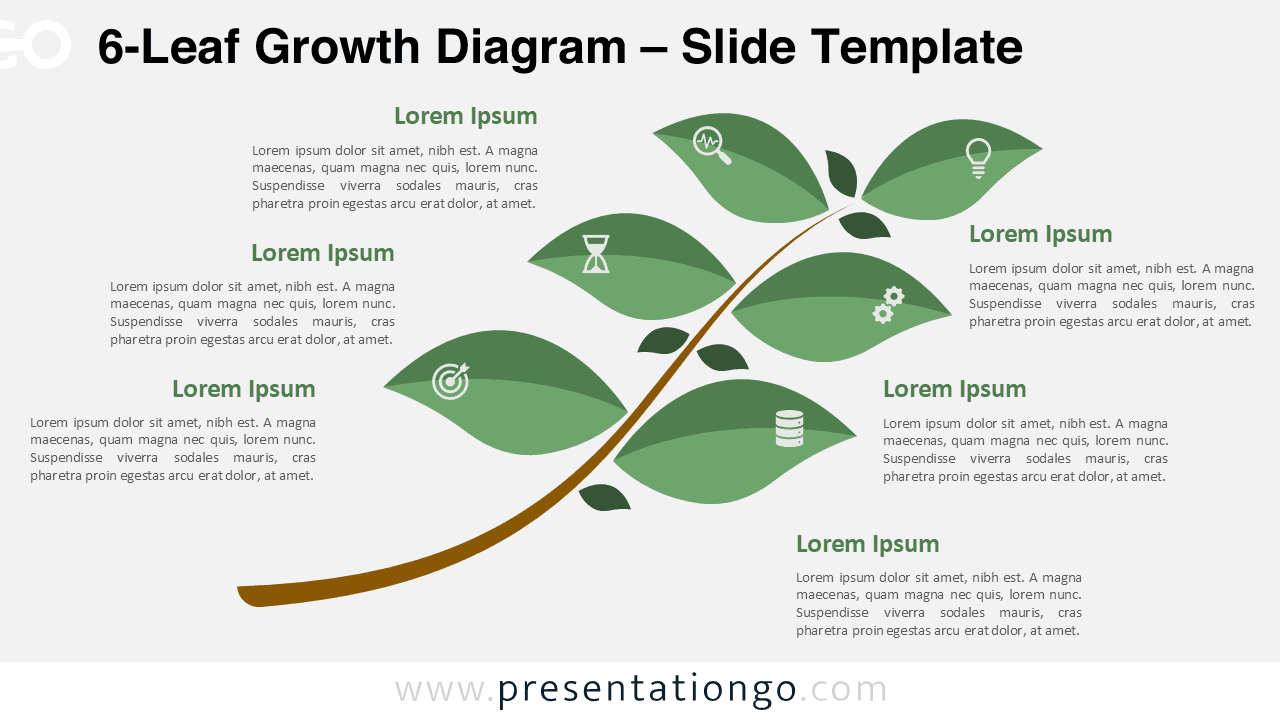
6-Leaf Growth Diagram
Visualize structured growth concepts with this editable 6-Leaf Growth Diagram for PowerPoint & Google Slides.
Google Slides, PPTX
16:9
