
Radial diagrams are becoming increasingly popular nowadays since they allow you to present your facts in an aesthetic manner. We generally use them to illustrate a relationship between different items and a central one. The 10 free templates we offer you will light up your presentation and impress your audience. So make your selection and choose the best radial diagram templates for PowerPoint and Google Slides!
When you want to link several elements to a central idea, item, or concept, the best way to do it is by using a radial diagram. It usually has a circular or semi-circular shape that makes it very easy for your audience to spot and identify the information. These charts emphasize both the core element and the information in the outer ring of circles. That’s why it is ideal for concept maps or radial Venn diagrams, for instance. Radial diagrams can actually flow from the outside in or the inside out.
Our selection will provide you with a wide range of designs to highlight your ideas and concepts: converging and diverging charts, radial diagrams with original shapes such as an octopus, a brain, a fan, a bow tie and even a backpack. These free radial diagram templates will definitely be the ray of sunshine of your presentations!
1. Converging Radial Diagram
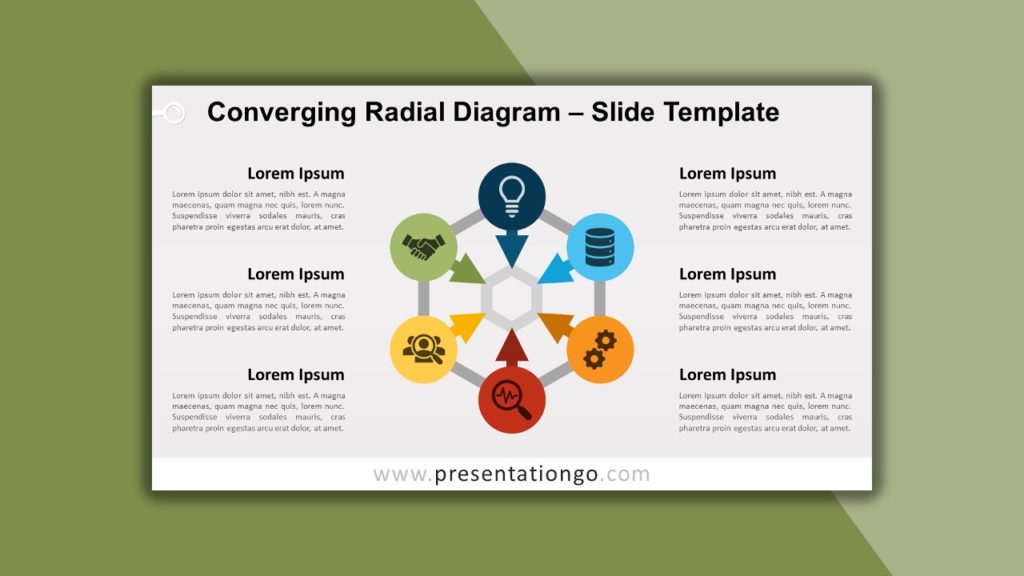
Our first option is a classical circular converging diagram. The convergence of the 6 elements towards the central item is made clear by arrows directed towards the core concept. The outer ring of circles stands over a hexagonal shape that brings power to your presentation. Besides, each colorful circle can be filled with an icon to represent your idea or fact. You can also use it to illustrate a continuing sequence of 6 stages, tasks, or events in a circular flow.
2. Octopus Diagram
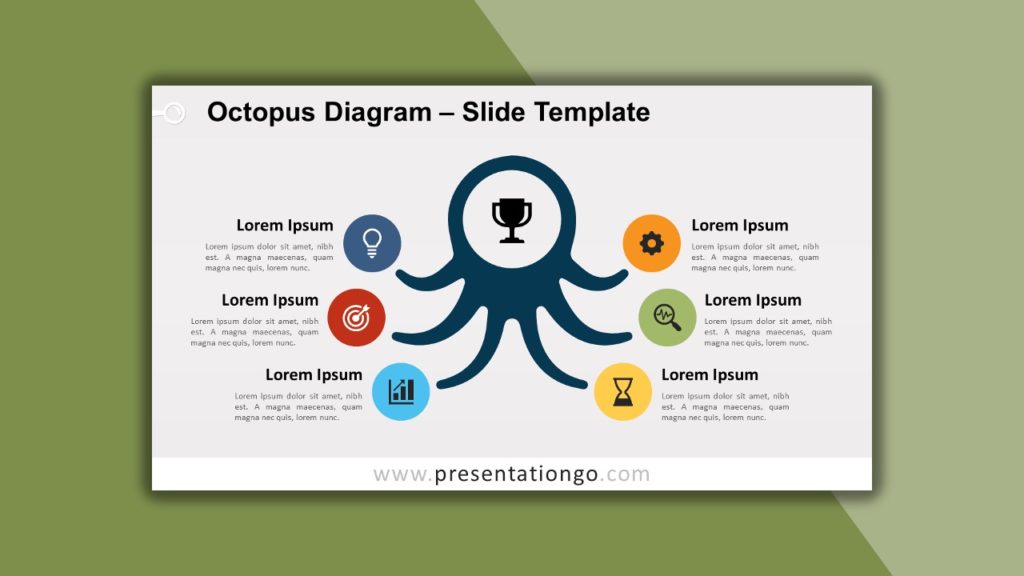
Another option for you to illustrate 6 converging or diverging ideas from a central concept is this fun and original octopus diagram. The octopus’ round-shaped head serves as a frame for your text or your icon representing your main item. Besides, you will find a colorful circle at the end of each tentacle, a metaphorical representation of the relationship to your central idea. Finally, remember that this cephalopod is one of the smartest animals in the sea, so show your brilliant ideas thanks to it!
3. Radial Diagram with 4 Orbits
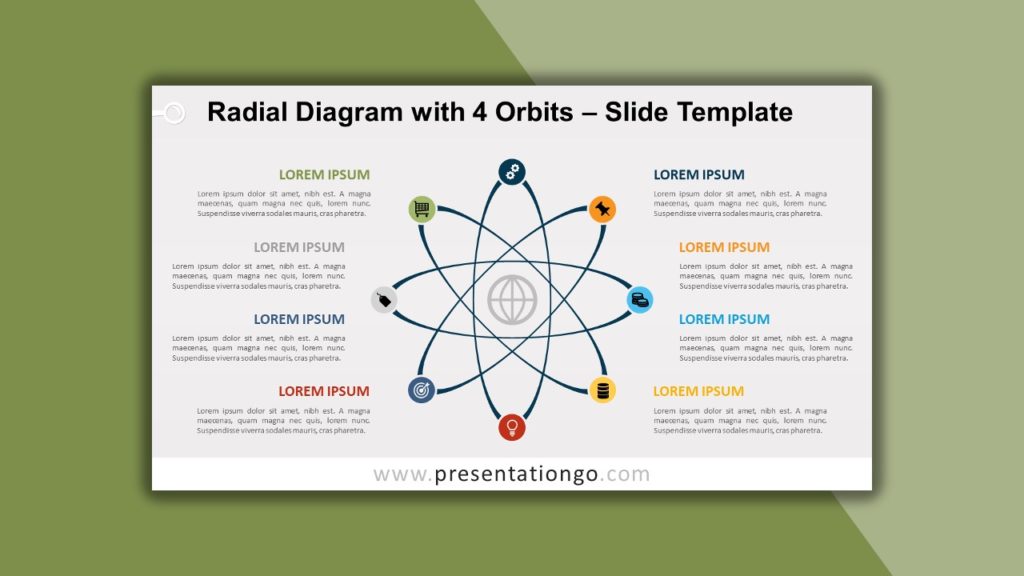
Put your ideas into orbit thanks to this free radial diagram for PowerPoint and Google Slides! This circular chart showcases 4 ellipses that remind us of the orbital path of planets around the sun or of electrons around the nucleus. You can therefore use it to represent 8 (4 orbits with 2 elements) interconnected ideas or concepts. Besides, it is a perfect illustration of their relationship with the core idea. Finally, you can easily customize this template thanks to icons, titles, and text placeholders.
4. Female Radar Brain
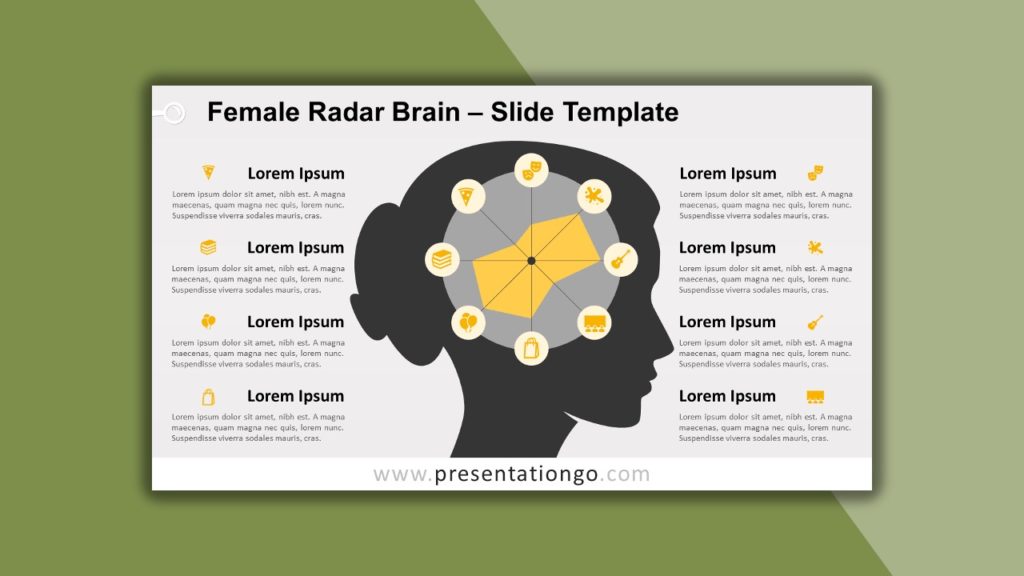
Do you want to show the world your brilliant ideas in a highly original fashion? Stop racking your brains! This template representing a woman’s head silhouette will amaze everybody! The brain obviously evokes knowledge, ideas, thoughts but also brainstorming and network. In this graphic, we replaced the brain with a radar chart (also known as the spider, radar, or web chart) that allows you to present eight aspects or variables. Each one can actually be illustrated by an icon and explained by a title and short text. You can also find the male brain version on our website.
5. Venn Diagram with 5 circles
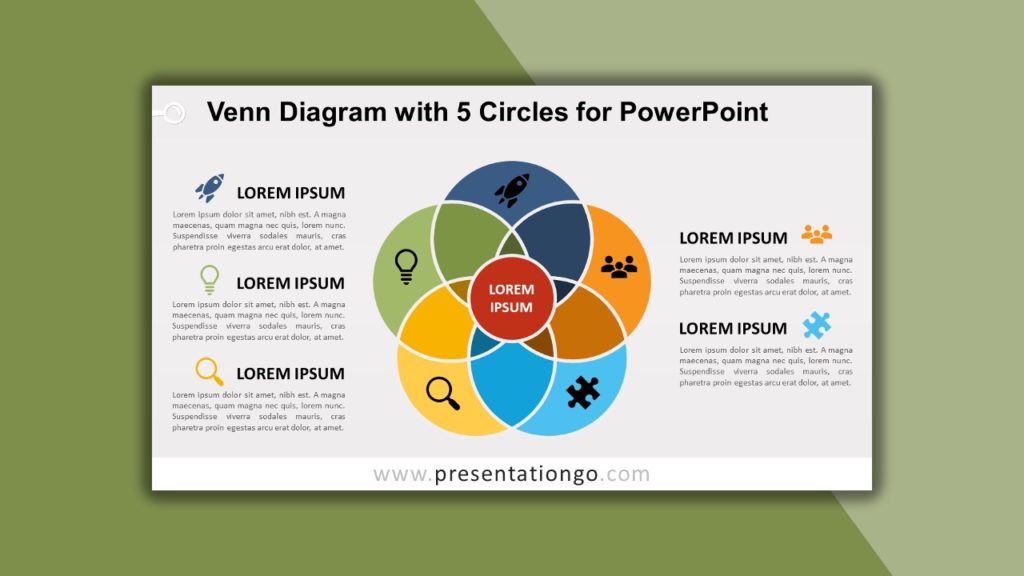
The big advantage and main characteristic of a Venn diagram are the multiple overlapping curves or circles. Such a chart, therefore, allows you to show all possible logical relations between a finite collection of different sets. In this case, we offer you a beautiful design reminding us of a flower and its petals, in which you can showcase 5 interconnected ideas or concepts. This logic diagram is also perfect to link these ideas to a core concept in the center. Last but not least, the slide leaves plenty of space for your texts on the side.
6. Radial Diagram for PowerPoint

The creative design of this free radial diagram will be key in the success of your presentation. Indeed, it displays an original pyramid made up of 4 semi-circular layers (like block arcs) and banner labels. Therefore, you can present 4 concepts or items and their relationship to a central idea. In addition, the 3D pyramid form allows you to order and hierarchize your groups of information. Definitely a must-have template in your toolbox!
7. Fan Radial Diagram
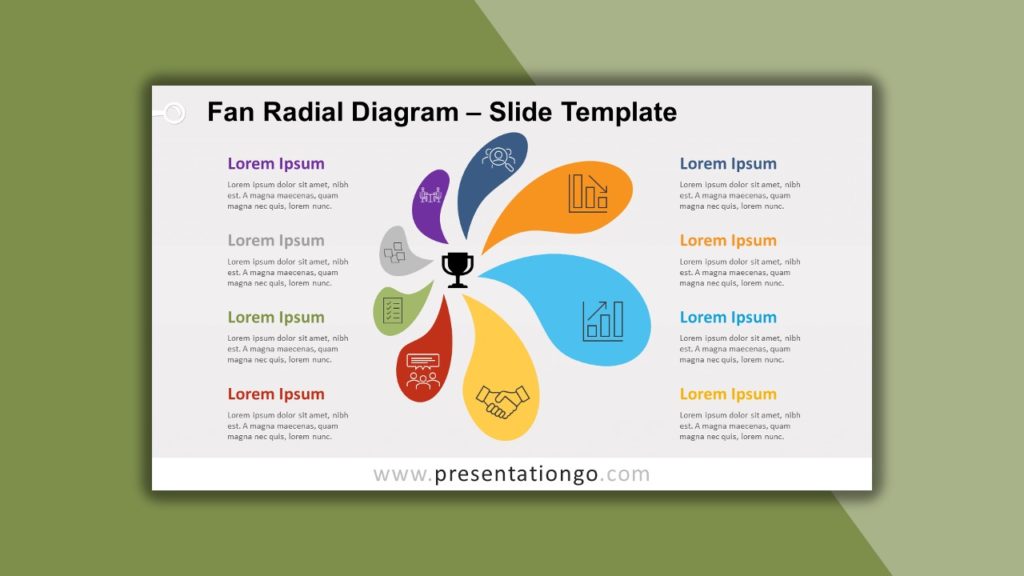
This free fan radial diagram for PowerPoint and Google Slides will spread some fresh air over your next presentation! This circular diagram shows eight colorful fan blades, which represents 8 items linked to a central idea. You can insert icons over each fan and detail your ideas on the side thanks to title and text placeholders. This modern infographic is also ideal if you want to convey an impression of movement and dynamism to your ideas.
8. Backpack Radial Cycle
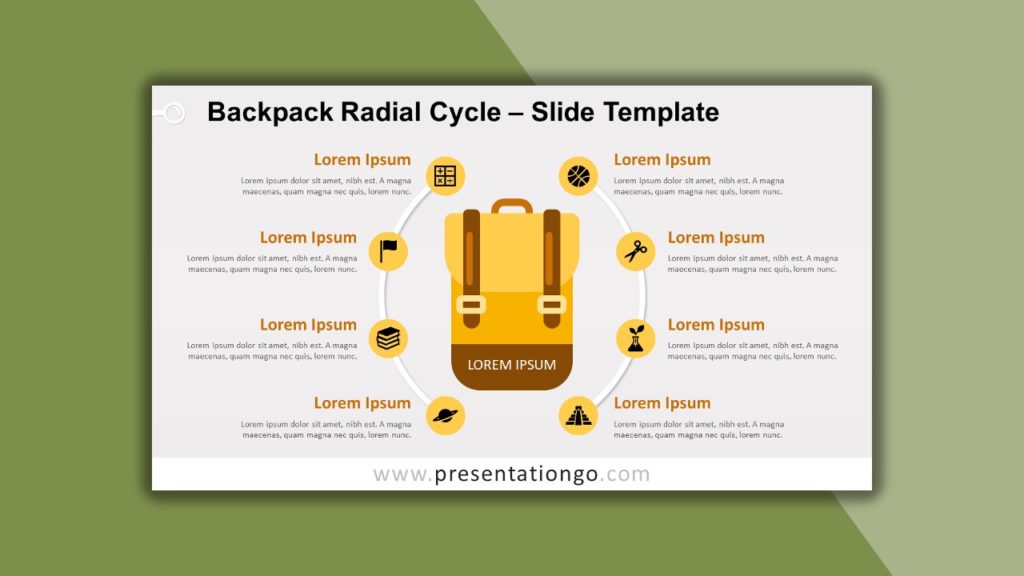
Time to pack up your best tools and head for your next presentation! This free radial cycle showcases the central image of a yellow and brown backpack. Around it, you will find two semi-circles with 4 events or elements on each side. This creative graphic is thus ideal to relate 8 ideas to a central concept. This chart is perfectly adapted to topics such as school, teaching, adventure but can also be used as a metaphor for any toolbox or important material you need.
9. Multi Bow Tie Diagram
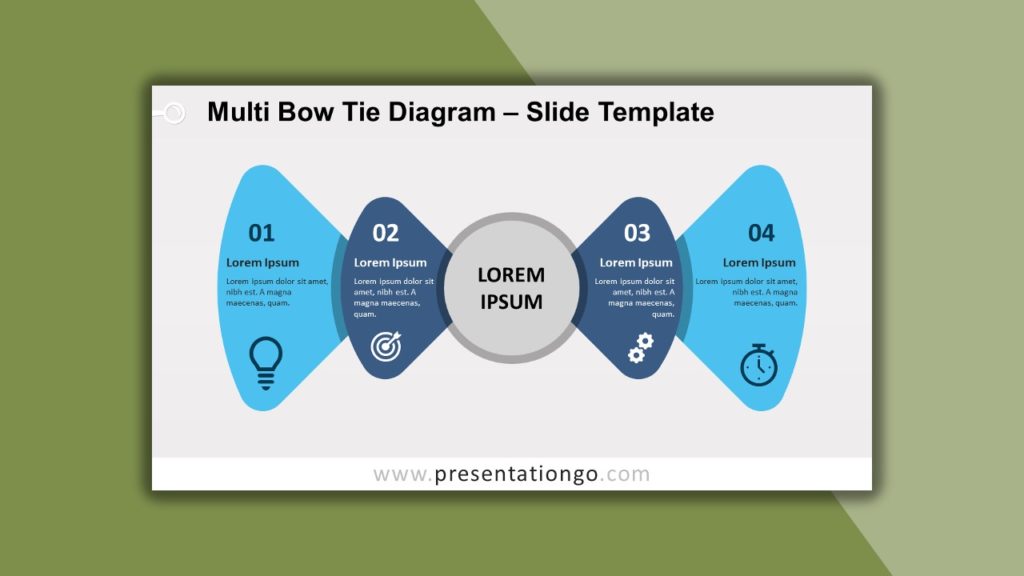
This free diagram for PowerPoint and Google Slides represents a double bow-tie shape. This singular design makes it perfect to illustrate a number of things. For instance, a progression or sequential steps in a task, process, or workflow but also a radial chart in which two 2-step elements converge to (or diverge from) a central point. Your main idea lies in the center and your ideas flow from it or to it on both sides. Dress up your presentation with the fanciest of templates!
10. Radial Network
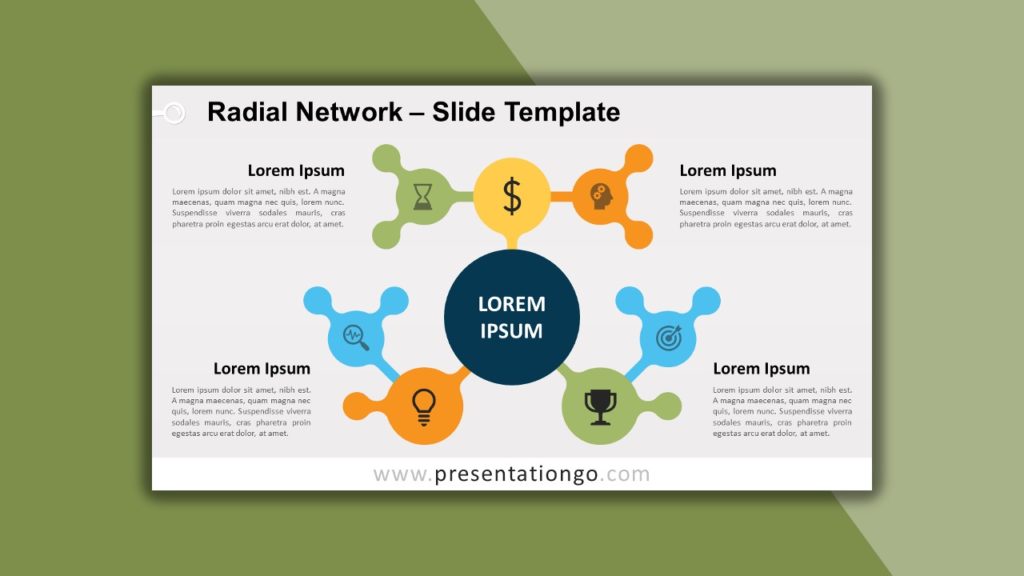
Sometimes an idea leads you to another, which leads you to another, and so on. If you want to illustrate this network of ideas, this free infographic will be your best ally. The design represents round shapes that remind us of puzzle pieces with their knobs and outies. This template is easily editable so you can personalize it to your convenience. Moreover, it leaves you enough space inside the circles for text and icons and also on the sides for your written explanations and titles.
We hope you like our selection of the 10 Incredible Radial Diagrams Templates for Presentations.
