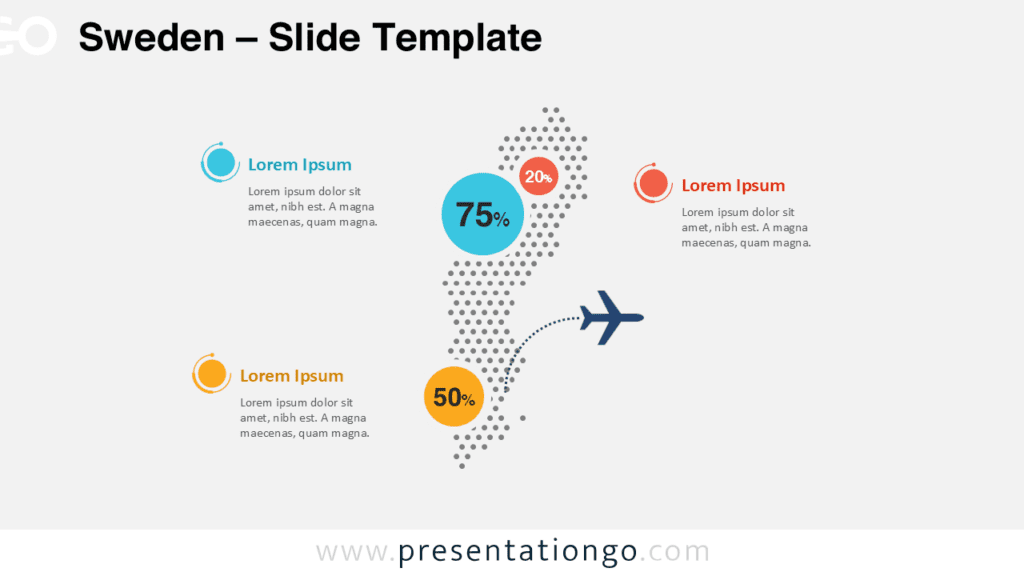
The Sweden Insights Map helps you present geographic information in a clear and structured way. It combines an editable map of Sweden with four supporting content areas and a central insight callout. This balanced layout makes complex regional information easier to understand. You can use it to explain business performance, demographics, market activity, public policy, tourism, or operational results.
The slide works in both PowerPoint and Google Slides. Each section supports concise text, while the map creates an immediate geographic reference. The design also includes a second version for presentations that use a darker visual theme. Both versions follow the same layout, so you can switch between them without changing your content.
Slide Template Preview
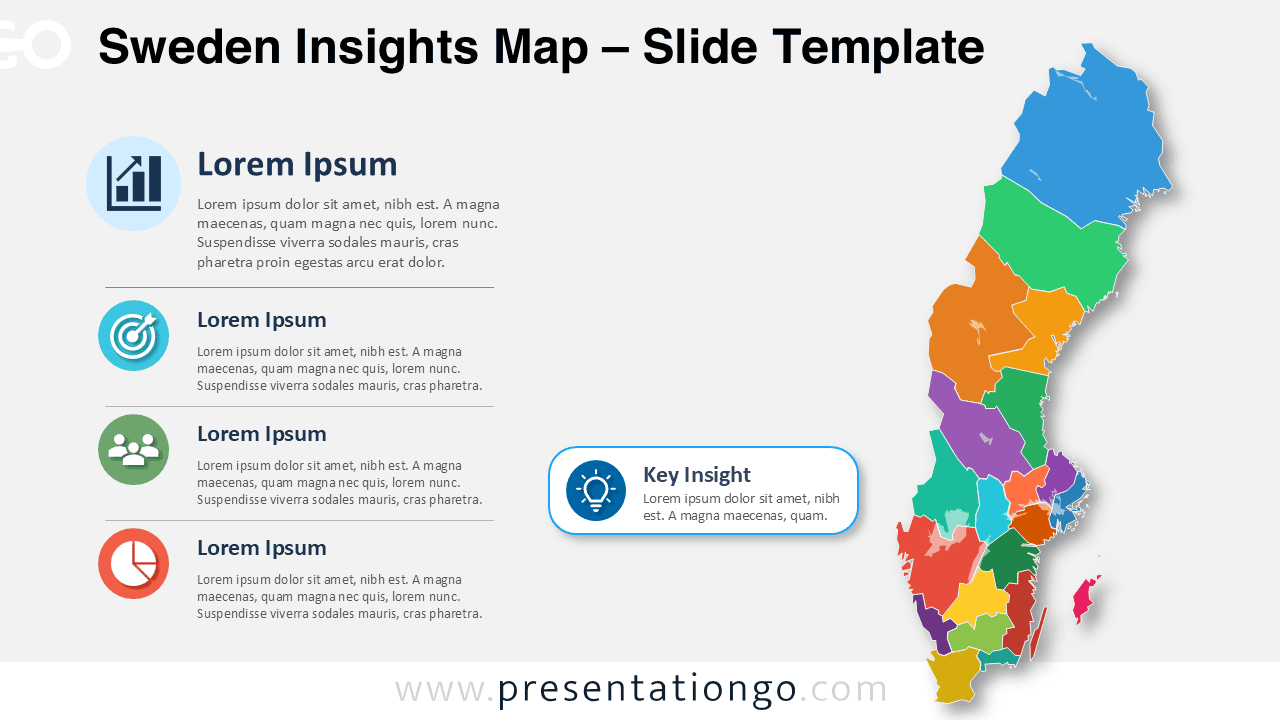
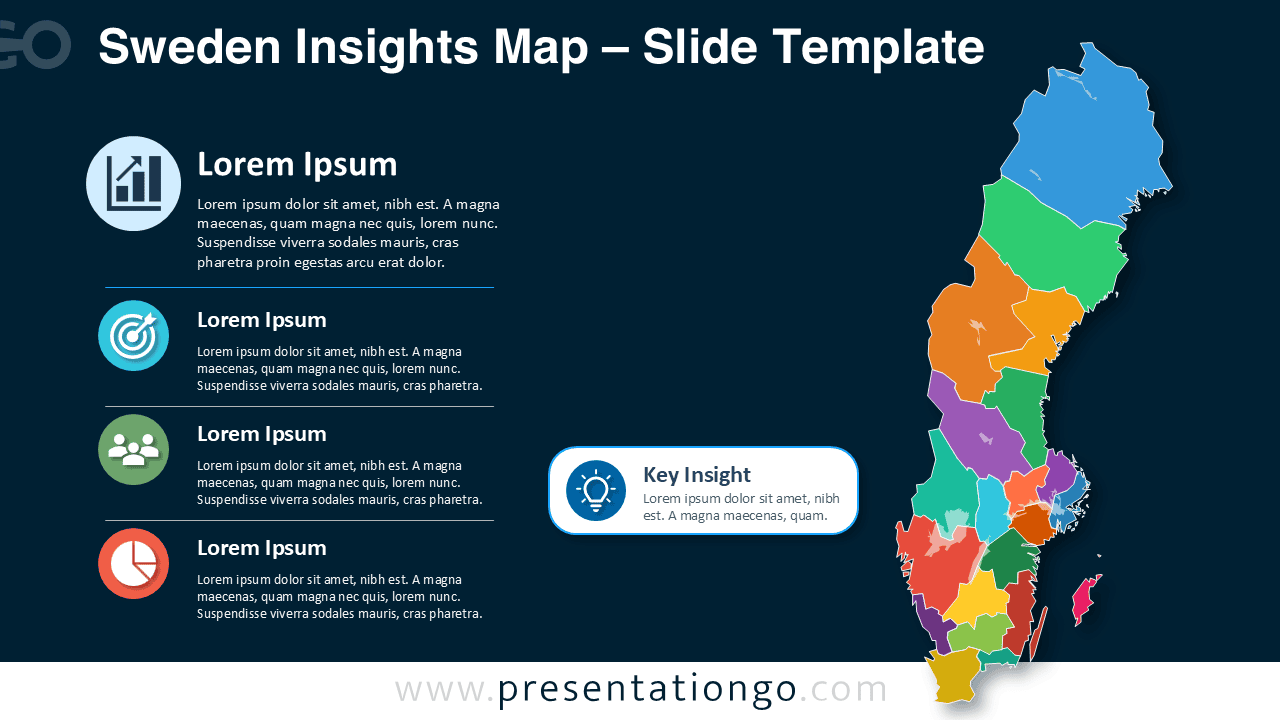
The Sweden Insights Map places the geographic visual on the right and the supporting analysis on the left. This structure gives the map strong visual importance while keeping explanations easy to scan. The central callout connects the regional information to one main conclusion, recommendation, or strategic message.
Features and Customization Options
- Edit individual Swedish regions to match your data or reporting needs.
- Replace the placeholder text with regional statistics, findings, or recommendations.
- Use the four content blocks to organize separate themes or performance indicators.
- Highlight one major conclusion in the central key insight callout.
- Modify the icons from the Microsoft Office icon library quickly and easily.
- Replace the existing icons with other Office library icons that fit your subject.
- Adjust text size, labels, shapes, and spacing to match your presentation style.
- Use the slide in PowerPoint or import it into Google Slides for online editing.
Design and Structure
The slide uses a simple two-column composition. Four information blocks create a logical reading sequence on the left. Each block includes an editable icon placeholder, a short heading, and space for supporting text. The Sweden map appears as a set of separate regional shapes, allowing you to emphasize specific areas or organize data by territory.
A rounded callout sits between the text and map sections. You can use this area for a key insight, priority, warning, opportunity, or executive summary. The layout keeps this message visible without competing with the main regional content.
Practical Applications
- Compare sales performance across Swedish regions.
- Present market research and expansion opportunities.
- Explain demographic or economic differences.
- Summarize tourism, transport, or infrastructure data.
- Report public sector initiatives and regional outcomes.
- Show customer distribution or service coverage.
- Support academic studies and geographic research.
- Present regional risks, priorities, or investment plans.
Summary
The Sweden Insights Map turns regional information into a focused visual story. Its editable map, structured content areas, Office library icons, and key message callout help presenters organize findings without overcrowding the slide. Use it to explain regional differences, support strategic decisions, or communicate geographic data with greater clarity in PowerPoint and Google Slides.