The free 2×5 Two-Level Chart for PowerPoint and Google Slides is a versatile graphic to convey complex, interconnected ideas with ease. Editable graphics with icons and text placeholders.
2×5 Two-Level Chart
A skillfully crafted slide can convey more meaning than a lengthy monologue. That’s why we suggest incorporating the 2×5 Two-Level Chart for PowerPoint and Google Slides into your presentations. This innovative, free template will help you effectively communicate intricate, connected concepts and elevate your infographics.
In fact, this multi-level (doughnut or donut) chart employs a sophisticated data visualization approach to display hierarchical relationships spanning multiple series.
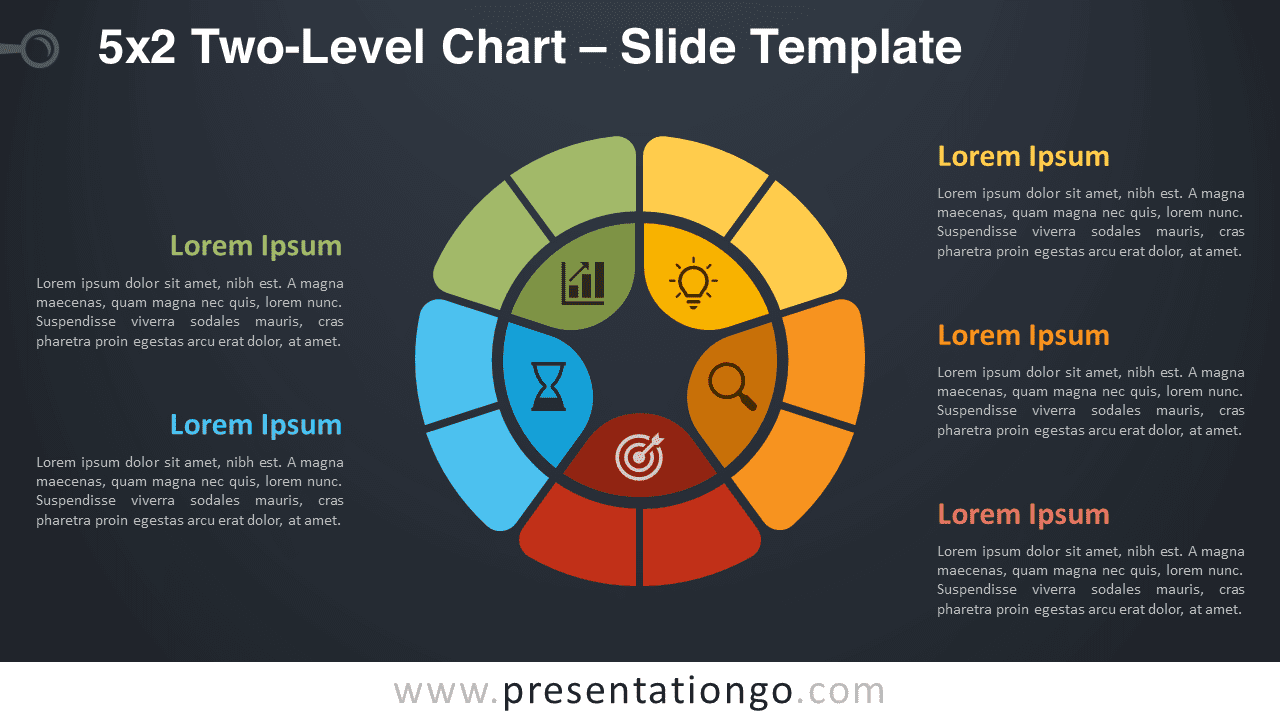
The design’s contemporary, user-friendly design guarantees effortless comprehension for your audience. Its circular and vibrant arrangement organizes information into digestible, visually attractive segments. At the center, an inner circle is divided into two separate sections, each accompanied by an icon representing your idea or step. This forms the root node. Encircling this inner circle is an outer circle, with each inner section further divided into five equal parts. These child items delineate their contributions to the parent category they are associated with.
Additionally, text placeholders positioned on either side of the chart enable you to offer comprehensive explanations for your ideas, thoughts, facts, or items of information. As a result, your audience can easily grasp the interconnected relationships.
Highlighting the adaptability of the 2×5 Two-Level Chart for PowerPoint and Google Slides, this template is ideal for presenting linked information, hierarchies, or ideas.
In summary, transform your presentations with our free 2×5 Two-Level Chart template. Download it and captivate your audience with the power of engaging data visualization.
Shapes are 100% editable: colors and sizes can be easily changed.
Includes 2 slide option designs: Standard (4:3) and Widescreen (16:9).
Widescreen (16:9) size preview:


This ‘2×5 Two-Level Chart’ template features:
- 2 unique slides
- Light and Dark layout
- Ready to use template with icons and text placeholders
- Completely editable shapes
- Uses a selection of editable PowerPoint icons
- Standard (4:3) and Widescreen (16:9) aspect ratios
- PPTX file (PowerPoint) and for Google Slides
Free fonts used:
- Helvetica (System Font)
- Calibri (System Font)
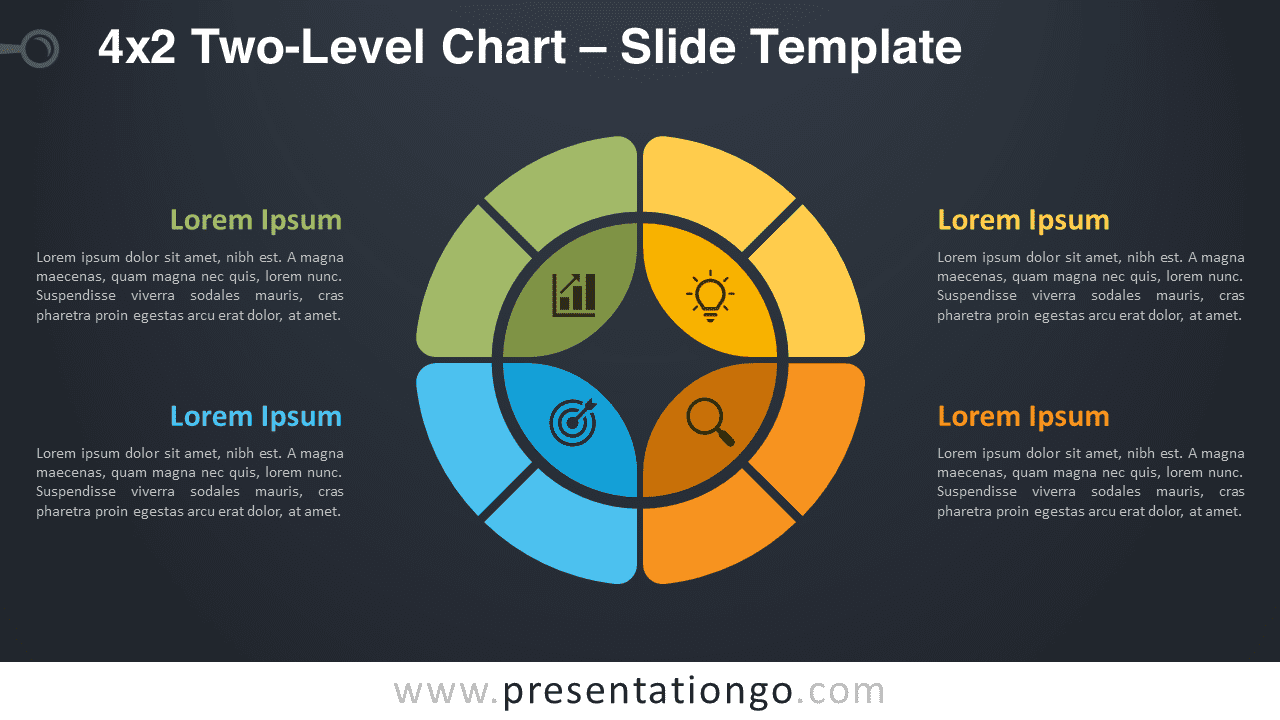
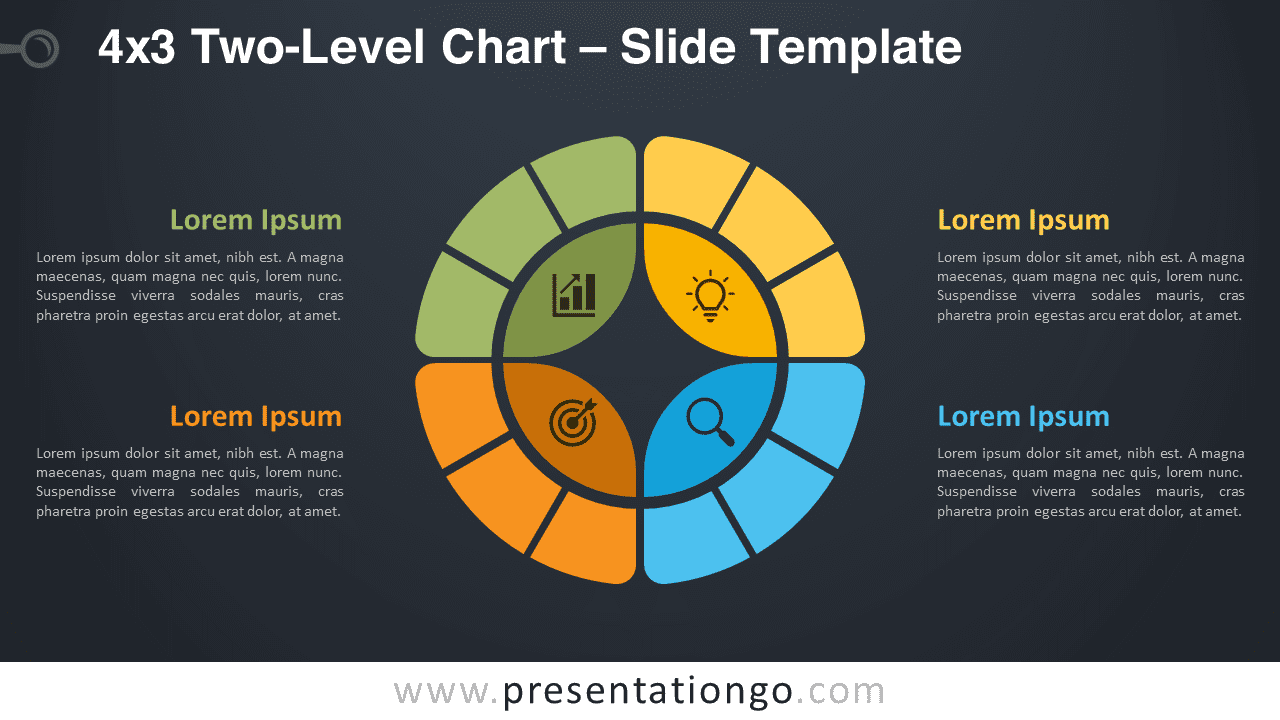
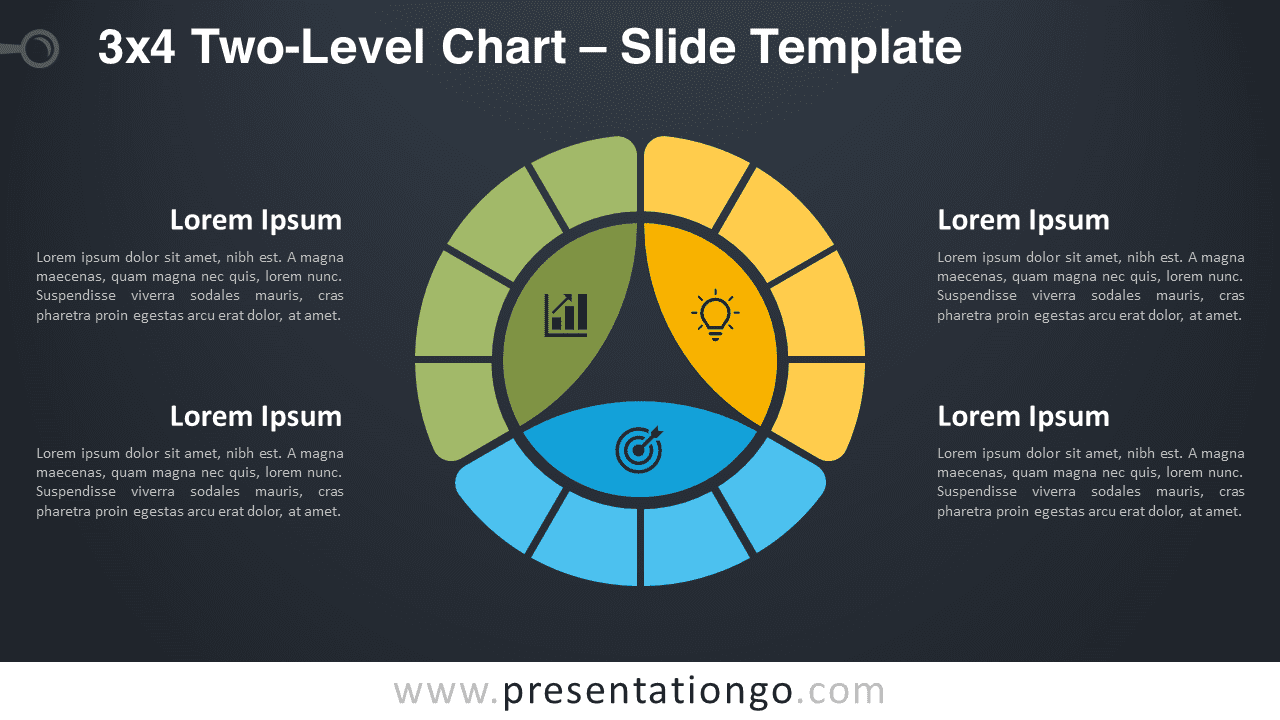
The complete Two-Level Chart collection: