Enhance your presentations by showcasing complex relationships and hierarchies with the 3×4 Two-Level Chart for PowerPoint & Google Slides.. Editable graphics with icons and text placeholders.
3×4 Two-Level Chart
A well-constructed slide can communicate more effectively than a drawn-out discussion. For this reason, the 3×4 Two-Level Chart for PowerPoint and Google Slides will efficiently present complex, interrelated ideas. Enhance your infographics with this flexible, complimentary template.
This multi-level (doughnut or donut) chart provides a robust data visualization technique to illustrate hierarchical connections across numerous series.
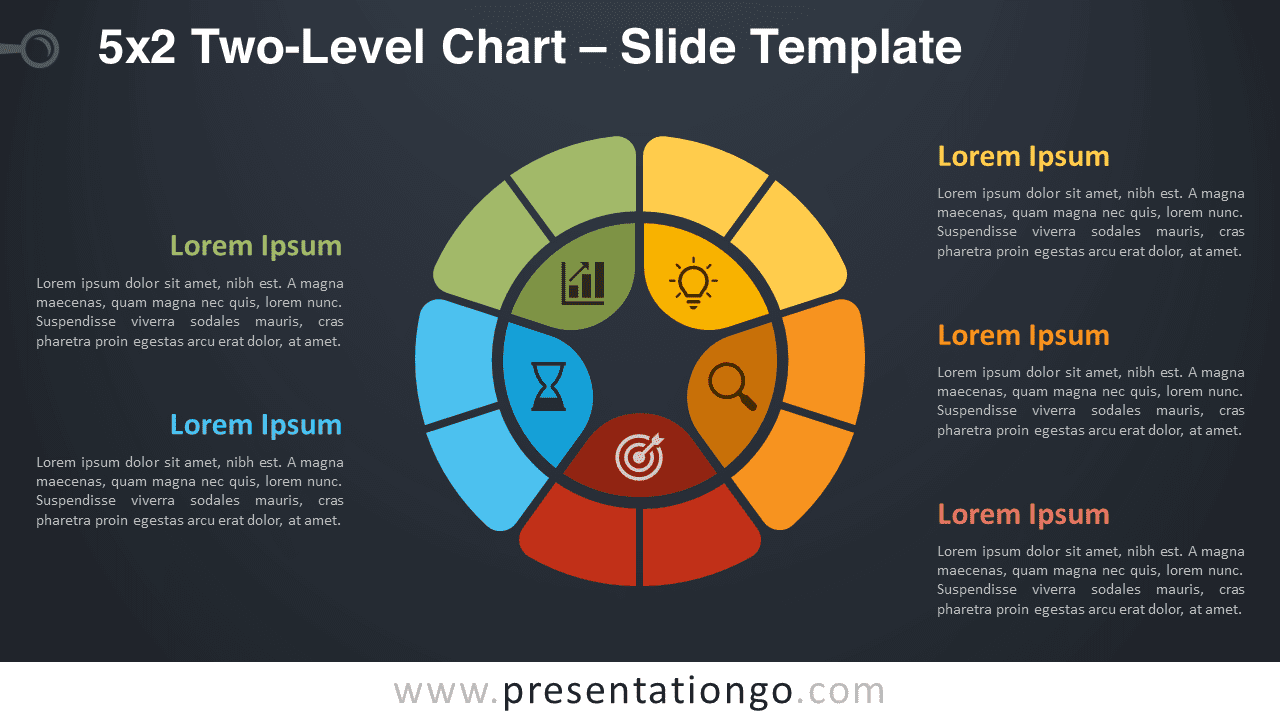
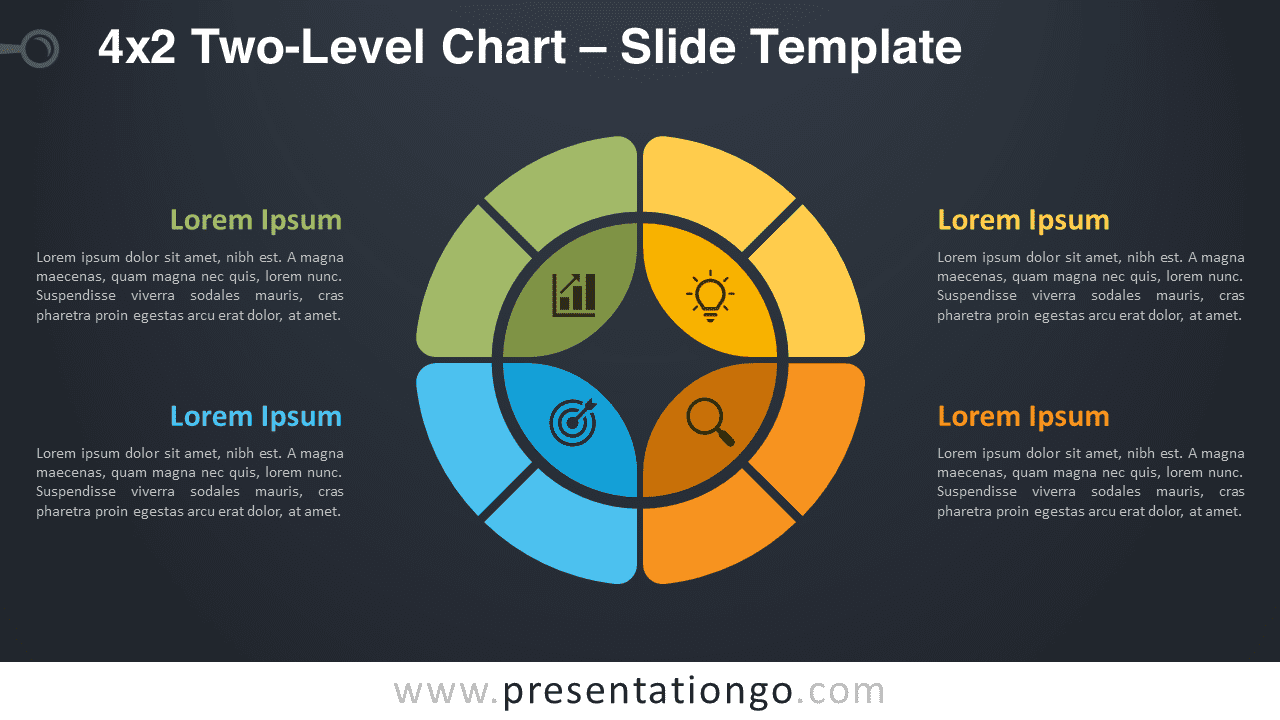
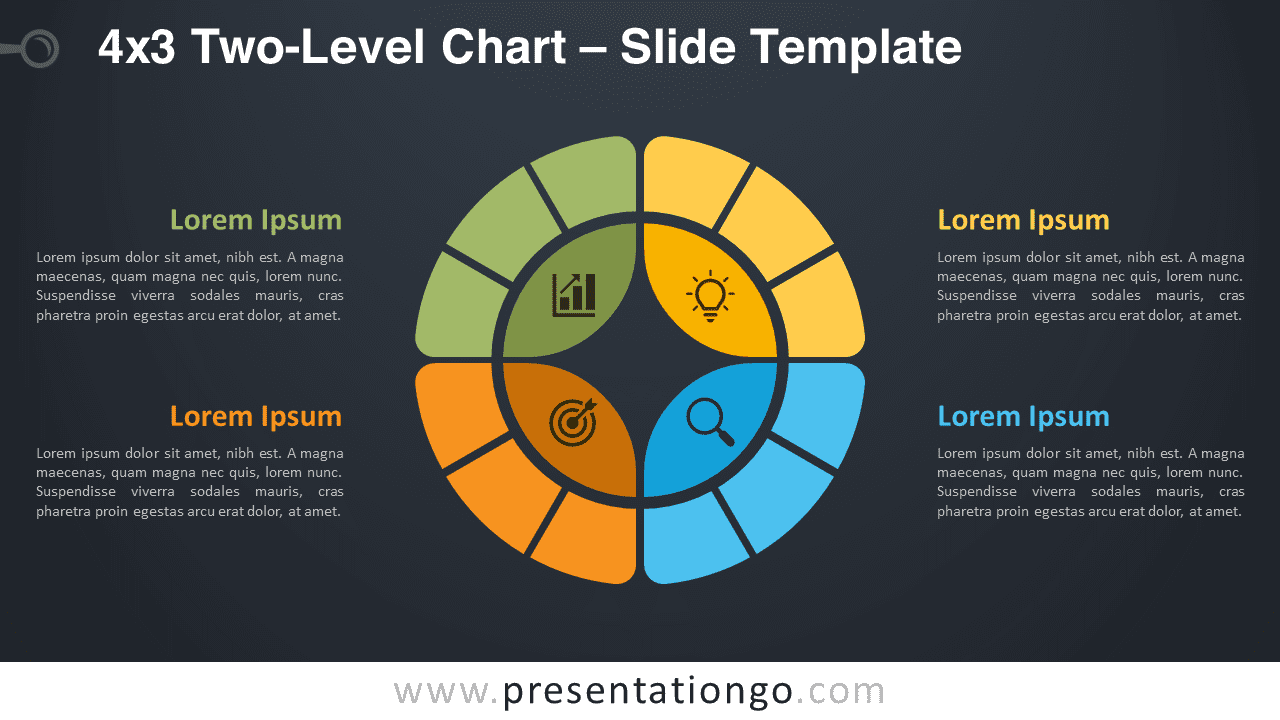
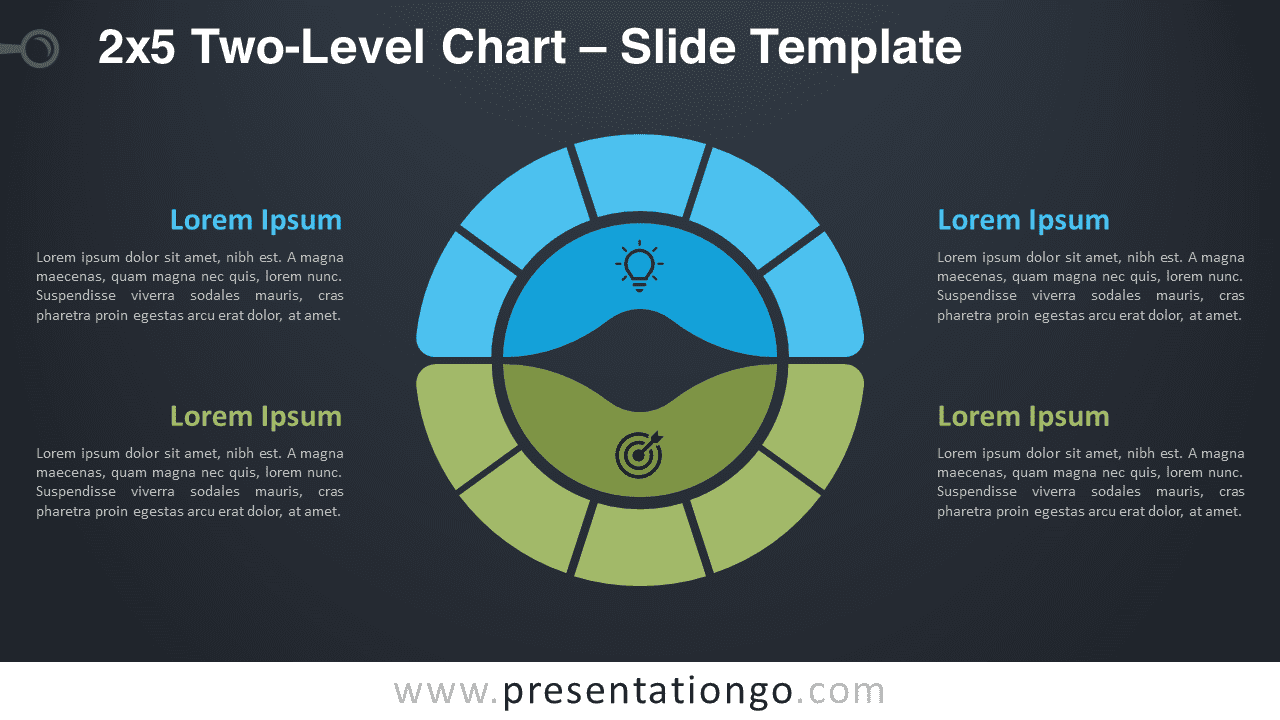
The modern, intuitive design of this slide ensures easy understanding for your audience. Its circular, colorful structure divides information into accessible, visually pleasing segments. The chart showcases an inner circle in the center, segmented into three distinct parts, each with an accompanying icon to demonstrate your idea or step. This constitutes the root node. An outer circle surrounds the inner one, where each inner section is further subdivided into four equal portions. These child items clarify their roles in relation to the parent category they correspond to.
Furthermore, text placeholders situated on both sides of the chart allow you to elaborate on your ideas, thoughts, facts, or items of information. This enables your audience to effortlessly follow and comprehend the interconnected relationships on display.
Emphasizing the versatility of the 3×4 Two-Level Chart for PowerPoint and Google Slides, this template is perfect for demonstrating connected information, hierarchical structures, or ideas.
In closing, elevate your presentations with our complimentary 3×4 Two-Level Chart template. Download it and leave a memorable impression on your audience through the power of compelling data visualization.
Shapes are 100% editable: colors and sizes can be easily changed.
Includes 2 slide option designs: Standard (4:3) and Widescreen (16:9).
Widescreen (16:9) size preview:


This ‘3×4 Two-Level Chart’ template features:
- 2 unique slides
- Light and Dark layout
- Ready to use template with icons and text placeholders
- Completely editable shapes
- Uses a selection of editable PowerPoint icons
- Standard (4:3) and Widescreen (16:9) aspect ratios
- PPTX file (PowerPoint) and for Google Slides
Free fonts used:
- Helvetica (System Font)
- Calibri (System Font)
The complete Two-Level Chart collection: